Edit 2D Grid Window
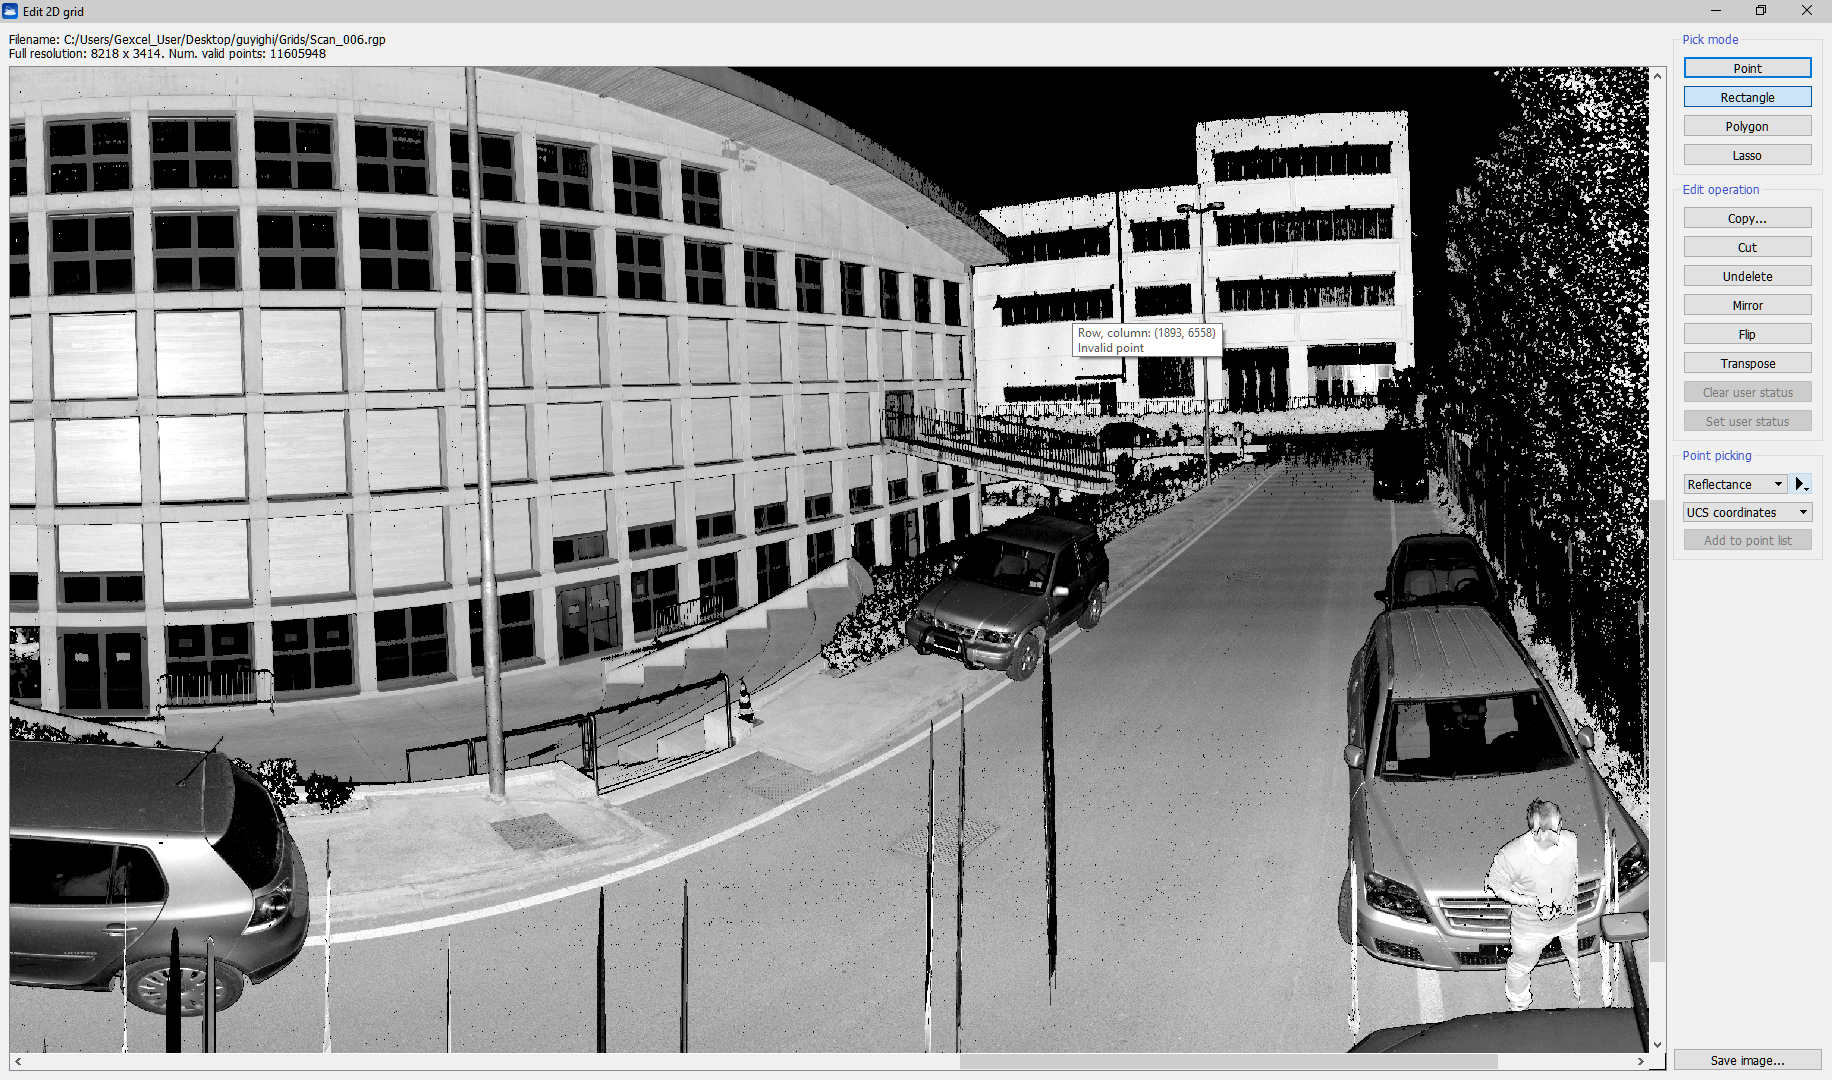
This window shows a grid point cloud in its 2D representation. Like in a geographic 2D map of the world, the grid point cloud is represented as an image where, for each point, the x coordinate is the yaw angle (longitude) and the y coordinate is the pitch angle (latitude) that the laser had while surveying that point.
In this window you can select, delete and undelete points with several functions.
To interact with the image
- Zoom in/out: Alt + mouse wheel
- Fit the image in the window: Alt + Middle Mouse Button (MMB)
- Reset to original size: Alt + Right Mouse Button (RMB)
- Translate the image: Shift + LMB drag
- Space bar: rotate image 90 degrees
- Show/hide zoom window: Z key
- Move zoom region inside global view: [Ctrl + LMB]
- While keeping pressed ...
- Shift: to perform union of regions
- Alt: to perform subtraction of regions
- Shift+Alt: to perform intersection of regions
Pick mode
- Point: pick a point and save it in a point list if Add to point list button is pressed.
- Rectangle: press Left Mouse Button (LMB) for the first point and keep it pressed while dragging the mouse to the second point, then release the LMB
- Polygon: click LMB for each point of the polygon. Close the polygon by double clicking the LMB
- Lasso: press Left Mouse Button (LMB) to start the polyline and drag the mouse to draw, then release the LMB to close the polyline
Edit operation
- Copy: create a new grid point cloud from the selected region
- Cut: delete the selected region
- Undelete: undelete the points inside the selected region
- Mirror: inverts the grid along the width. Only the ordering of the grid is changed, the 3D points are untouched
- Flip: inverts the grid along the height. Only the ordering of the grid is changed, the 3D points are untouched
- Transpose: transposes the grid. Only the ordering of the grid is changed, the 3D points are untouched.
Show
- Color type: display the grid with the selected color type. Press the right arrow to show a menu of available commands for the current color type
- Histogram: the histogram tool allows to optimize the contrast by histogram stretching (available only if the model is loaded in memory and if the current color type is 1f or 1d, i.e. a high-dynamic single-channel point color).
- Colors mapping : point colors can be remapped to a pseudo colored scale to improve the dynamic range, if the histogram stretching is not sufficient (available only if the model is loaded in memory and if the current color type is 1f or 1d, i.e. a high-dynamic single-channel point color). This tool can be also used for range segmentation and inspection.
- Global coordinates: display the 3D global coordinates of the point (i.e. using the pose of the model). Otherwise, the local model coordinates are used.
- Save image: save the current image to file.