Colors mapping
|
Colors mapping The purpose of this command is to manage and to create an artificial colorization for a given color layer of a point cloud. |

The user can manage the rest of Reconstructor®'s GUI while keeping this dialog open.
When a point cloud is pre-processed, extra-information is added, and this is organized into color layers. Information can be scalar (e.g. reflectance, range, confidence) or vectorial (e.g. inclination).
User can add color layers to a cloud pressing one of the buttons in the Colors Mapping window.
Only one color layer at a time is rendered in the 3D scene.
User can also change a cloud's current color from the layers list on the left of the colors mapping dialog or by clicking on property browser.
When a color layer is rendered, a colorization is used to associate the points' color values to a drawable color. Only scalar information can be mapped with colors through this dialog. The color layer Inclination is an exception: it represents the normals of the points and it is colored automatically.
Layers list
On the left there is a layers list that show which layers are associated to the current point cloud.
Map colors tab
The Color mapping window has the interface as below if a scalar layer is just selected from the property browser.
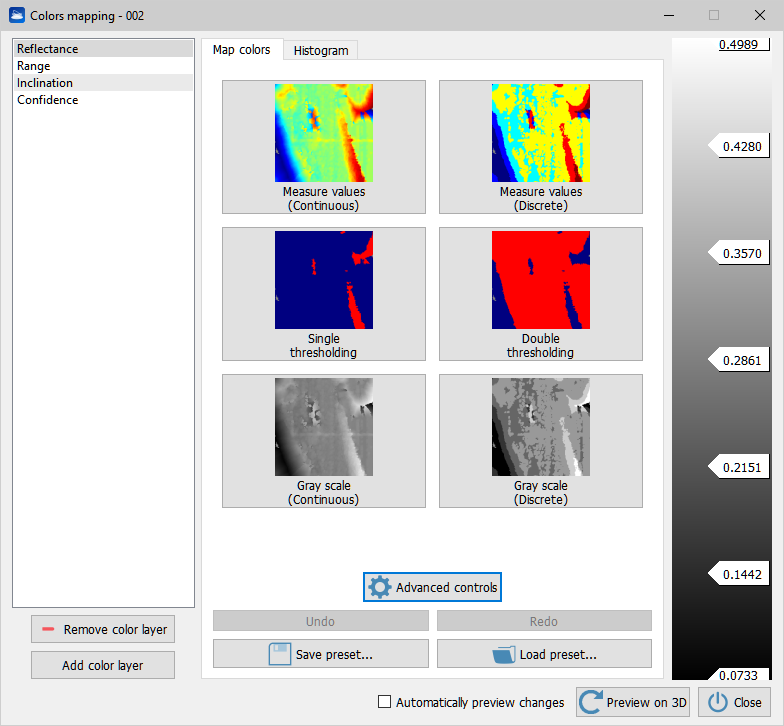
Predefined colors buttons
On the Center there is a set of buttons to apply a pre-defined colorizzation to the current selected layer.
Buttons used to map colors are:
- Measure values (continuous) : map the current layer to a continuous Rainbow Matlab style color.
- Measure values : map the current layer to a discrete Rainbow Matlab style color.
- Single thresholding: map the current layer to solid red and blue.
User can set a threshold moving up and down the central value label.
- Double thresholding: map the current layer to solid red and blue.
User can set two thresholds moving up and down the values labels.
- Gray scale: map the current layer to a continuous gray gradient.
- Gray scale (discrete): map the current layer to a discrete gray gradient.
Color scale
On the right there is a color scale that shows the selected colors map in combination with labels. Labels show maximum and minimum (bounding) values and also values between colors. User can choose among several types of color scales via Predefined buttons or by clicking on Advanced button. User can also disable colors by clicking on the color check box.
Advanced controls
The user can master colors and design or produce to meet his or someone's individual requirements.
Advanced commands are divided in three groups.
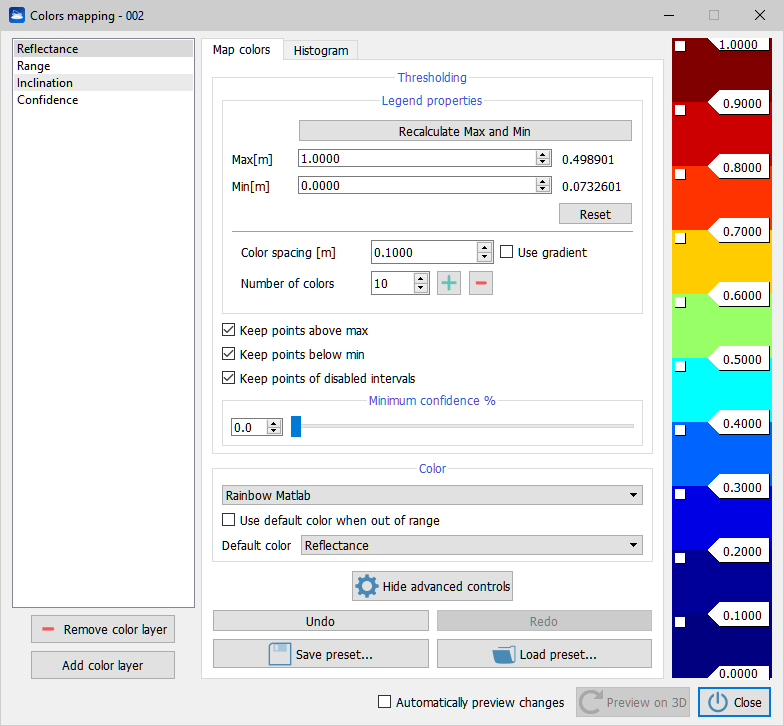
Legend properties:
- Max to set the max value and show it in the legend
- Min to set the min value and show it in the legend
- Colors spacing that give information about width of the color
- Number of colors that is useful to set the amount of colors to use
- Use gradient to switch between a discrete and a continuous colorization
- Decimals to set how many decimal digits use
Thresholding group:
- Keep points above max if selected keep points above "Max" value else points are hidden.
- Keep point below max if selected keep points below "Min" value else points are hidden.
- Keep point of disabled intervals if selected keep points in the deselected color else points are hidden.
- Minimum confidence to set manage confidence value.
Color group:
- Combo box to chose between six color styles:
- Single thresholding
- Double thresholding
- Extended
- Gray scale
- Rainbow
- Rainbow Matlab
- HSV scale
- Customize
- Use default color when out of range
If selected color with default (Gray color determined by reflectance value) is applied else the colors map is applied.
Histogram tab
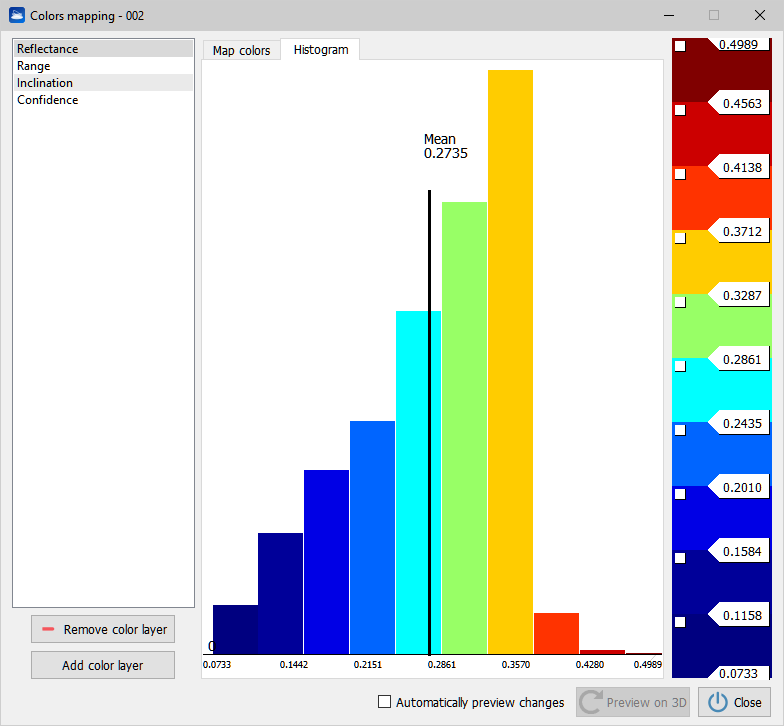
A colored histogram shows a statistical distribution with colors chosen by user. In abscissa, the histogram information about current measure (each color identifies a local radius of the measure) and in ordinate it shows a measure of how many occurrences of points are mapped to a color. The mean value is also shown.
Add color layer tab
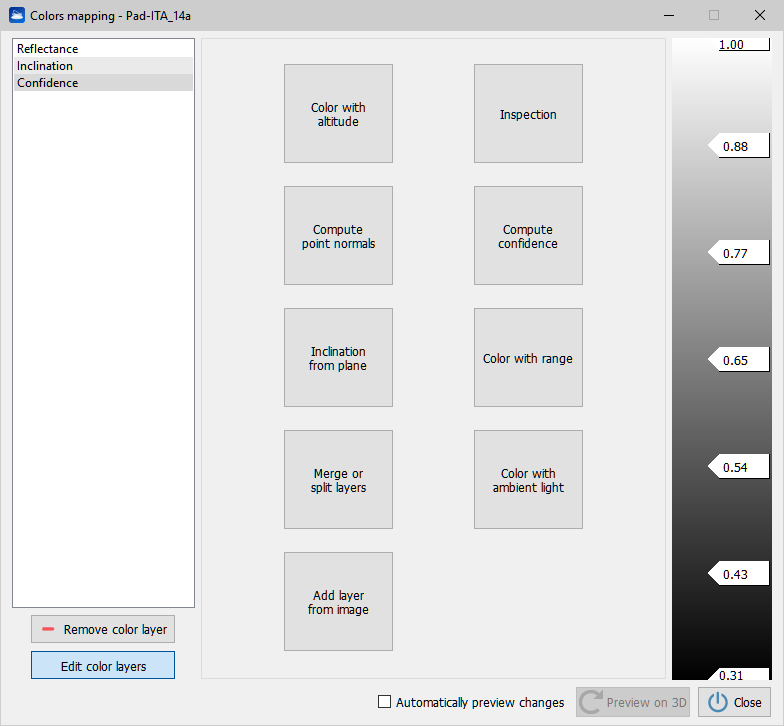
User can add color layers to a cloud via functions like Inspection or Color with altitudes by clicking buttons in Add color layer tab.
Buttons to add layers are:
- Color with altitudes. that insert a layer to color distances along an axis direction.
- Inspection that insert a layer to color distances between point cloud and a reference model (e.g. Mesh) .
- Compute point normals that insert a layer to colors normals of points coherent to a plane direction.
- Compute confidence that insert a layer to color confidence amplitudes.
- Inclination from plane that insert a layer to color inclination angles.
- Color with ambient light: visualization of outdoor large mapped areas can be enhanced with this layer.
- Color with range that insert a layer to color distance from the observation point.
- Add layer from image that apply an image on the point cloud (e.g. a 2Dview after a color editing). Pay attention to the dimensions of the images: they must be the same of the point cloud ones.
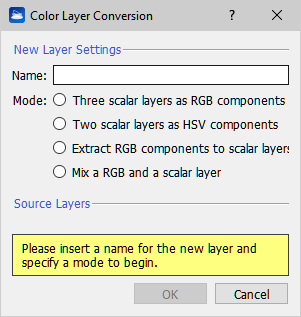
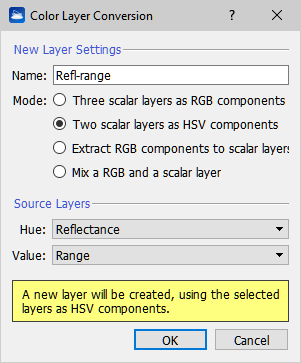
- Merge or split layers that combine RGB and scalar layers to obtain a customized new layer of color: