Navigation
In this chapter will be shown how to navigate in Heron Desktop, through HERON® data and in the several 3D windows of the software. The main interaction with the data is done in Mapper, but the same criteria are valid for other environments of the software.
Please refer to this content for navigation in Reconstructor®.
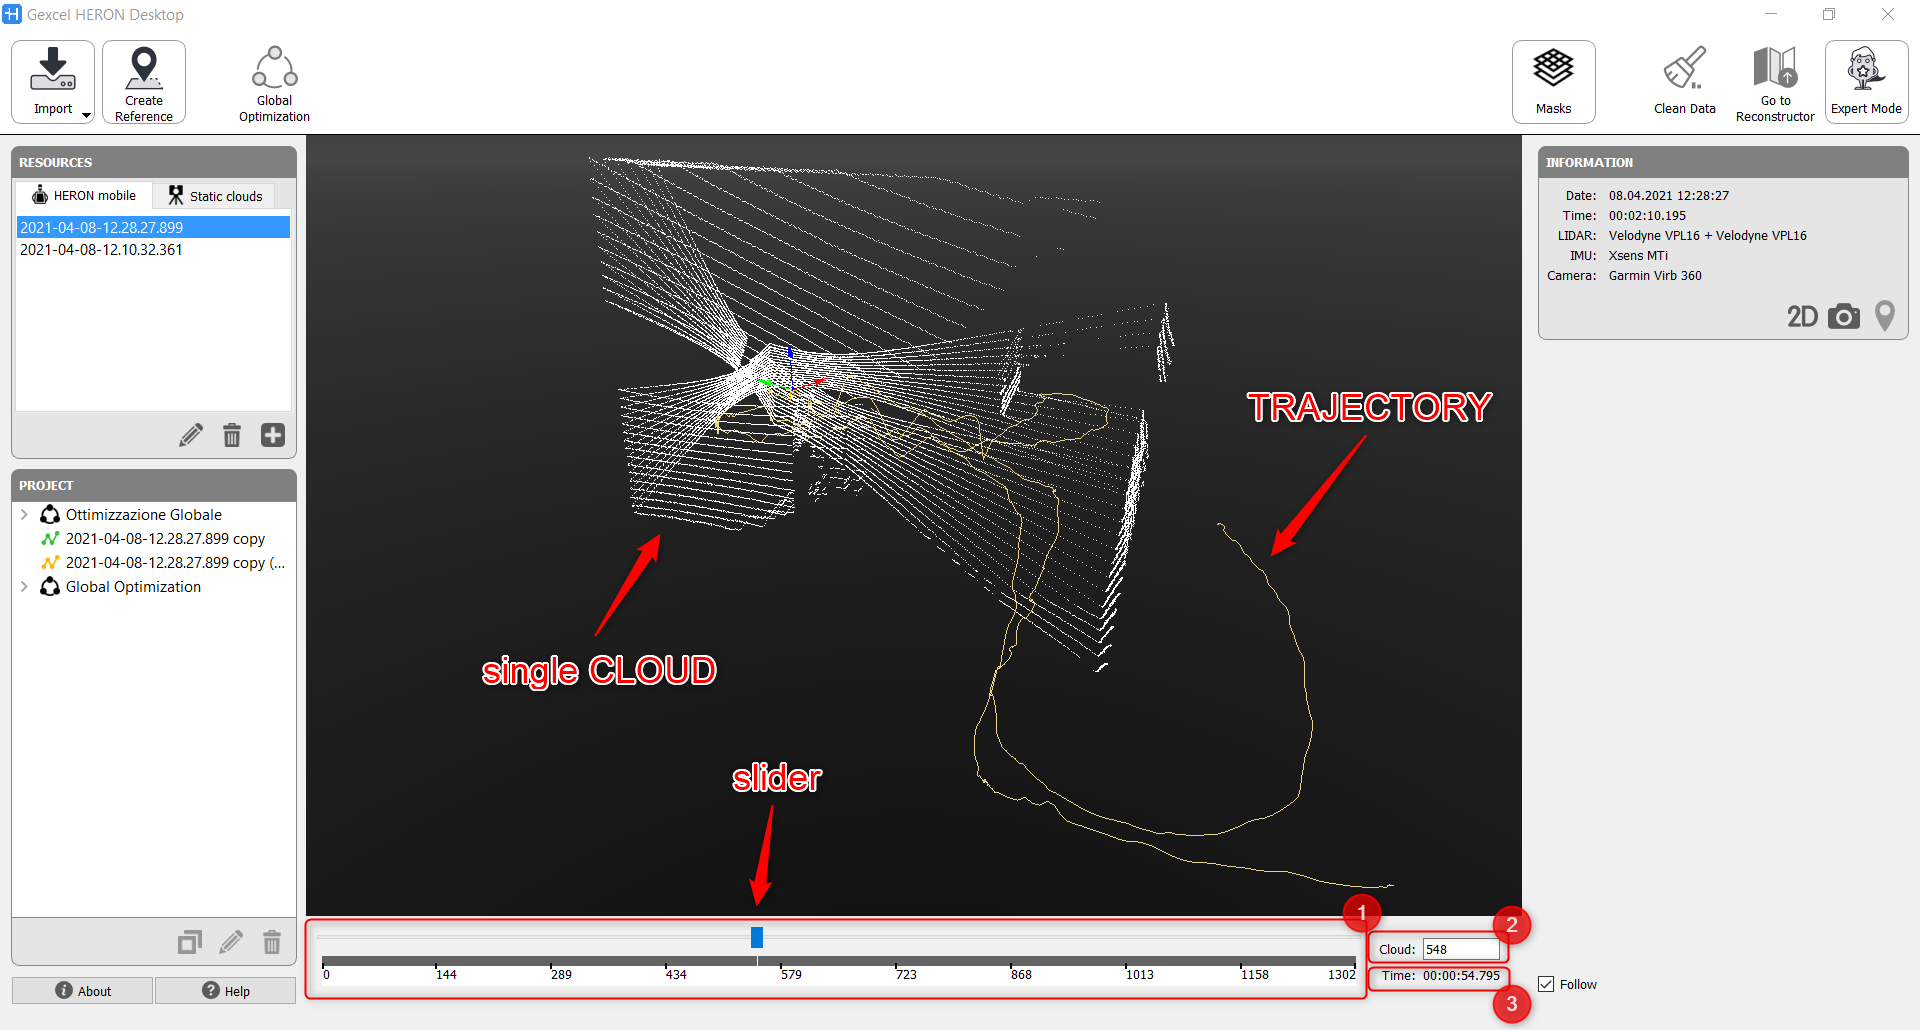
After importing the HERON® raw data in Mapper, they will be displayed in the 3D view as a Trajectory on which several Clouds (single point clouds from each rotation of the laser sensors) are related.
In case of an onsite survey with HERON® MS Twin, we have two sensors and the single cloud is given by the rigid union of the two synchronized sensor acquisitions.
In the lower part of the window, a time bar shows the series of the clouds ➊, where each one is defined at a given step by a sequential number ➋ and by the time [hh:mm:ss] of acquisition ➌. Cloud: 0 and Time 00:00:00.00 define the starting point of the survey.
Browse through the time bar to display the clouds along the survey path by pressing and moving the slider or by positioning the mouse cursor on the time bar and scrolling the CMB. A particular cloud of the acquisition can be directly reached inserting its defining number in the "Cloud" input field ➋.
To navigate the data (both raw and already processed) in 3D view the following modes are available.
|
To rotate the model in 3D view |
|
|
To pan the view |
|
|
To zoom in / zoom out |
|
Refer to single modules to learn how to navigate and interact with data in particular case (e.g. Global Optimization).