Inspection
|
|
Inspection is a procedure to compare two different shapes and to measure their differences in geometry. It is accessible from Measures tools in the top toolbar. |

It is normally used to compare two models of the same objects surveyed at different moments in time. For example, it is used for monitoring barrels of nuclear waste to immediately detect possible deformations.
The result of the inspection is a new color layer that will be assigned to the point cloud to inspect. This color layer carries, for each point, its measured distance from the reference model. After performing Inspection tool it is possible to use the Colors mapping dialog function to map these measures with colors chosen by user and to see the corresponding color scale and histogram.
Two different processes are performed depending on the type of models to be compared: clouds and clouds/meshes.
1. Cloud to Mesh
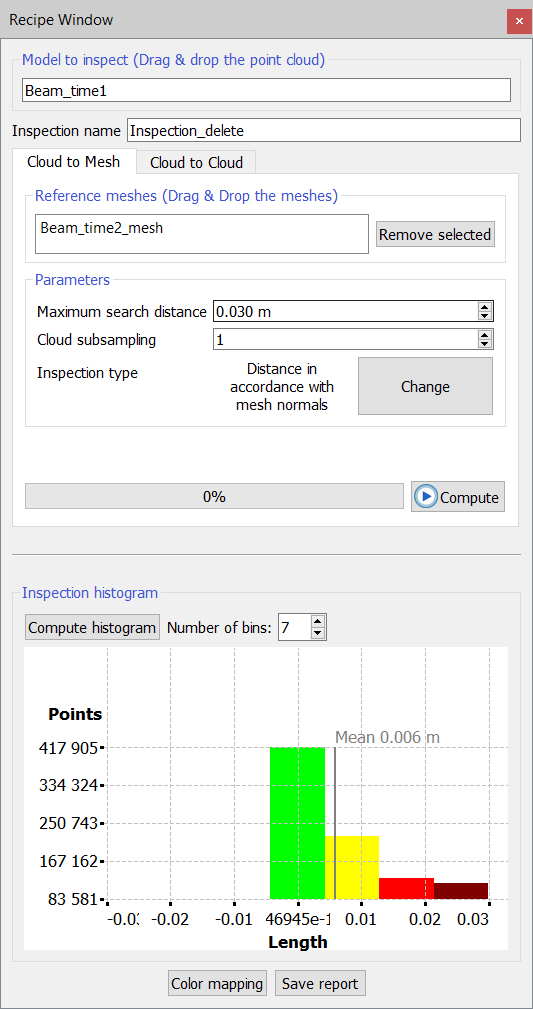
Input models
As inputs, user must provide a model to inspect and one or more reference models. The model to inspect must be a point cloud. The reference models must be triangle meshes.
The desired models can be inserted simply by dragging and dropping them. Press Remove selected to deselect undesired models from your import.
Parameters
- Inspection name: to define a name for the layer that will be that will be generated
- Maximum search distance: every point of the model to inspect will be compared with the reference model only inside a sphere with a radius defined by this parameter.
- Cloud subsampling: allows to balance speed versus precision.
There are two cases:
- Inspect an unstructured point cloud: the cloud will be divided in s sets of points and only one point in each set will be inspected. The other s – 1 points will be assigned the same distance value measured for that point.
- Inspect a grid point cloud: the procedure will scan the points according to their structure. The grid's structure will be divided in cells of dimension s by s. Only one point per cell will be inspected and the other points will get the same inspection value measured for the first.
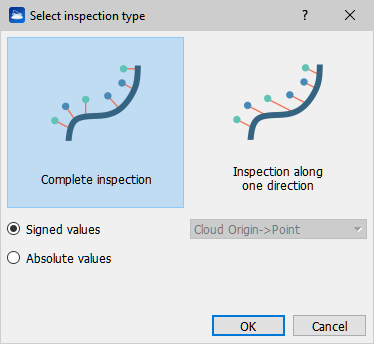
- Inspection types: to select the Inspection type to be performed by clicking " Change" button.
|
|
Complete inspection Inspection along one direction
Distances as signed values: distances will be computed with positive sign when measure direction is oriented in accordance with the normal at the point to inspect, negative otherwise. Distances in absolute values: distances will be computed in absolute value absolute values. |
2. Cloud to Cloud
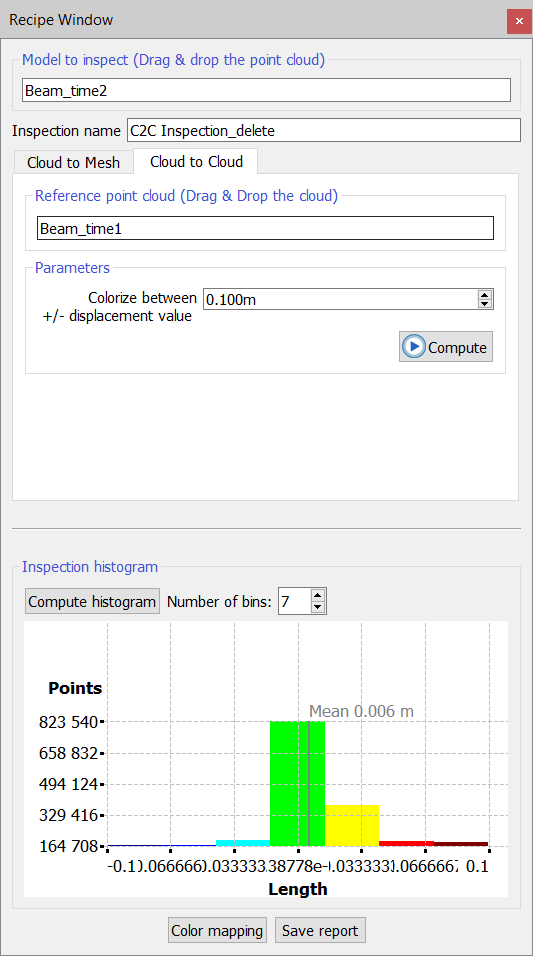
Input models
As inputs, user must provide a model to inspect and one reference model. Both models must be a point cloud (structured or unstructured).
The desired models can be inserted simply by dragging and dropping them. Press Remove selected to deselect undesired models from your import.
The result will be saved in a new color layer of the inspected cloud which represents the minimum distance values of each point with respect to a respective triangle built on the neighborhood of points of the reference cloud.
Parameters
- Inspection name: to define a name for the layer that will be generated
- Colorize between +/- displacement value: threshold (absolute) value used to define the limits of the scale colorization.
![]() This inspection tool always provides a distance value for each visible point of the inspecting cloud, unlike the mesh-to-cloud inspection, where the maximum search distance constrains the maximum range of measurable distance values.
This inspection tool always provides a distance value for each visible point of the inspecting cloud, unlike the mesh-to-cloud inspection, where the maximum search distance constrains the maximum range of measurable distance values.
![]() The sign of the displacement measure is conditioned by the point cloud origin; be careful if the model to be inspected is an unstructured point cloud.
The sign of the displacement measure is conditioned by the point cloud origin; be careful if the model to be inspected is an unstructured point cloud.
After defining the inspection modalities, press ![]() Compute to start the inspection process.
Compute to start the inspection process.
The resulting layer is appended to the color type list of the inspected point cloud, with the desired Inspection name.
Press Compute histogram button to calculate and plot (as well as to update) the histogram showing the statistics of the data distribution, after defining the number of bins you want to plot.
Use Colors mapping tool (linked in the bottom of the dialog) to optimize the colorization and the color legend.
Press Save report to collect all the information (histogram, statistics, picture with color legend, ...) in a PDF report.
Follow the step-by-step video tutorial performing an Inspection process in tanks analysis.