Colors mapping
|
|
Colors mapping The purpose of this command is to manage and to create an artificial colorization for a given color layer of a point cloud. |
The user can manage the rest of Reconstructor®'s GUI while keeping this dialog open.
When a point cloud is pre-processed, extra-information is added, and this is organized into color layers. Information can be scalar (e.g. reflectance, range, confidence, inspection) or vectorial (e.g. color, inclination).
When a color layer is rendered, a colorization is used to associate the points' color values to a drawable color. Only scalar information can be mapped with colors through this dialog. The color layer Inclination is an exception: it represents the normals of the points and it is colored automatically.
Only one color layer at a time is rendered in the 3D scene.
Layers list
On the top left of the Colors mapping dialog is a layers list showing which layers are associated to the current point cloud.
User can use it to switch from one color layer and another as well as can use the relative command in the property browser.
After selecting a cloud's color layer, the user can remove it by pressing the ![]() Remove color layer command.
Remove color layer command.
Map colors tab
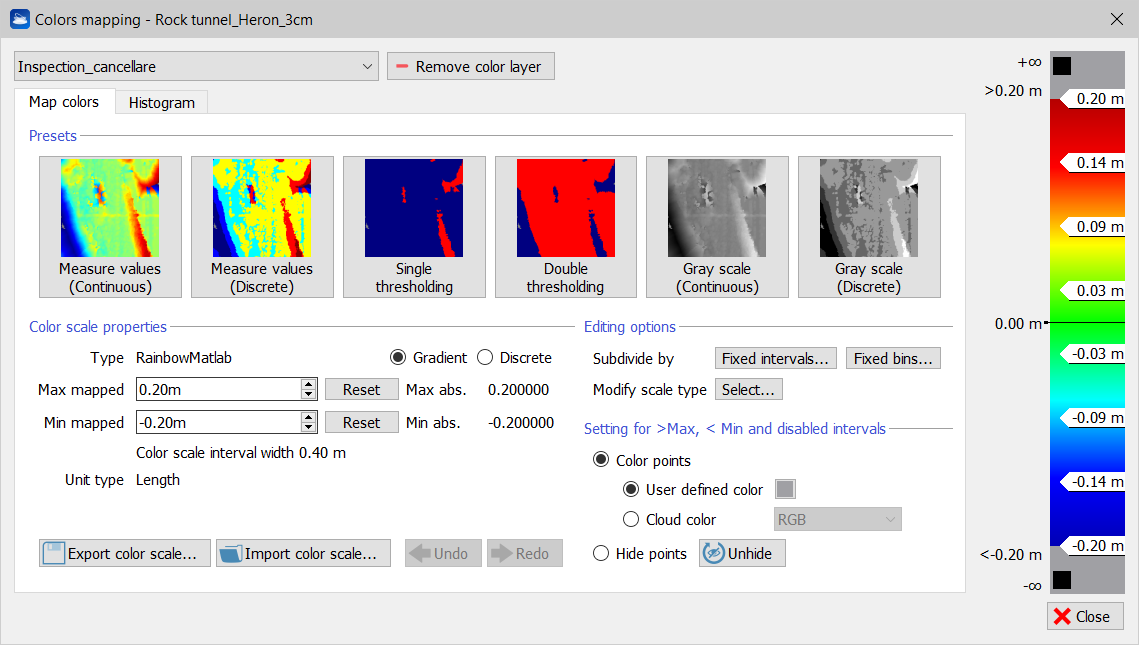
The Colors mapping window has the interface as below if a scalar layer is selected.

Presets
In the Map Color tab there is a set of buttons to apply a pre-defined colorization to the current selected layer.
Buttons used to map colors are:
- Measure values (continuous) : map the current layer to a continuous Rainbow Matlab style color.
- Measure values : map the current layer to a discrete Rainbow Matlab style color.
- Single thresholding: map the current layer to solid red and blue.
- User can set a threshold moving up and down the central value label.
- Double thresholding: map the current layer to solid red and blue.
User can set two thresholds moving up and down the values labels.
- Gray scale: map the current layer to a continuous gray gradient.
- Gray scale (discrete): map the current layer to a discrete gray gradient.
Color scale properties
On the right there is a color scale that shows the selected colors map in combination with labels. Labels show maximum and minimum (bounding) values and also values between colors. User can choose among several types of color scales via Presets and by managing the Editing Options. User can also change and disable colors by clicking on the color check box.
The following scale properties are displayed:
- Max mapped to set the max value and show it in the legend (click on Reset button to reset to the maximum absolute value)
- Min mapped to set the min value and show it in the legend (click on Reset button to reset to the maximum absolute value)
- Colors scale interval with that gives information about width of the color intervals
- Unit type that is depending on the type of colorization
Editing options
Colors intervals in the scale can be subdivided by:
- Fixed intervals according to the unit type (measure of unit)
- Fixed bins according to a defined number of equal spaced bins
The scale type can be modified by selecting one of the following options:
- Extended
- Gray scale
- Rainbow
- Rainbow Matlab
- Ironbow
- HeronChanges (*)
- HeronAlarmChanges (*)
(*) HeronChanges and HeronAlarmChanges are two color scale presets similar to that used in the Heron® Desktop Tracking Odometer: a sequence of colors (in the order green, yellow and red) to represent the change values with respect to the reference map.
After running the Heron® Desktop's Tracking Odometer process, it's possible to export a point cloud not only including xyz coordinates and RGB information of the points but also a scalar value that represents the distance of the point from the reference map used in the process. This point cloud can be imported into Reconstructor® and the color related to the change scalar data is written in a color layer named "Changes" to which the HeronAlarmChanges color scale is applied.
HeronChanges, on the other hand, is a preset that can be manually applied to models.
Setting for > Max, < Min and disabled intervals
When out of range, two modalities of points colorization can be chosen:
Color points: all the points out of the (Min,Max) interval are colored with an user defined color or with a chosen cloud layer of color (e.g. Reflectance, Inclination, ...)
Hide points: all the points out of the (Min,Max) interval are hidden.
By clicking on the Unhide button all the points previouvsly hidden will be made visible.
Histogram tab

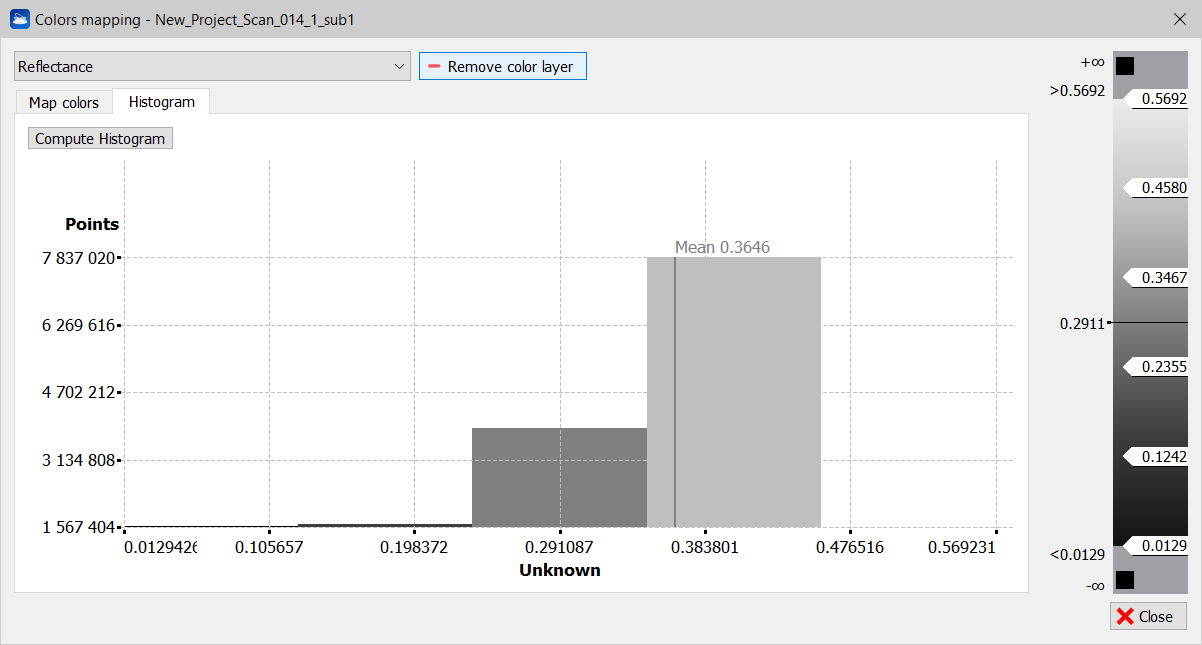
A colored histogram shows a statistical distribution with colors chosen by user. In abscissa, the histogram information about current measure (each color identifies a local radius of the measure) and in ordinate a measure of how many occurrences of points are mapped to a color. The mean value is also shown.
Click on Compute Histogram to extract it after creating or modifying it.
Follow the Reconstructor video tutorials also to perform the Colors Mapping processes.

