Single Trajectory Workflow
![]() This workflow will be here outlined by using the Preset Mode. Same workflow can be followed with Automatic Mode or Expert Mode.
This workflow will be here outlined by using the Preset Mode. Same workflow can be followed with Automatic Mode or Expert Mode.
This is the simplest workflow in HERON Desktop software to post-processing HERON® trajectories.
For any single HERON® acquisition acquired by HERON® mobile mapping system, its trajectory will go through this main workflow as shown in the scheme below.
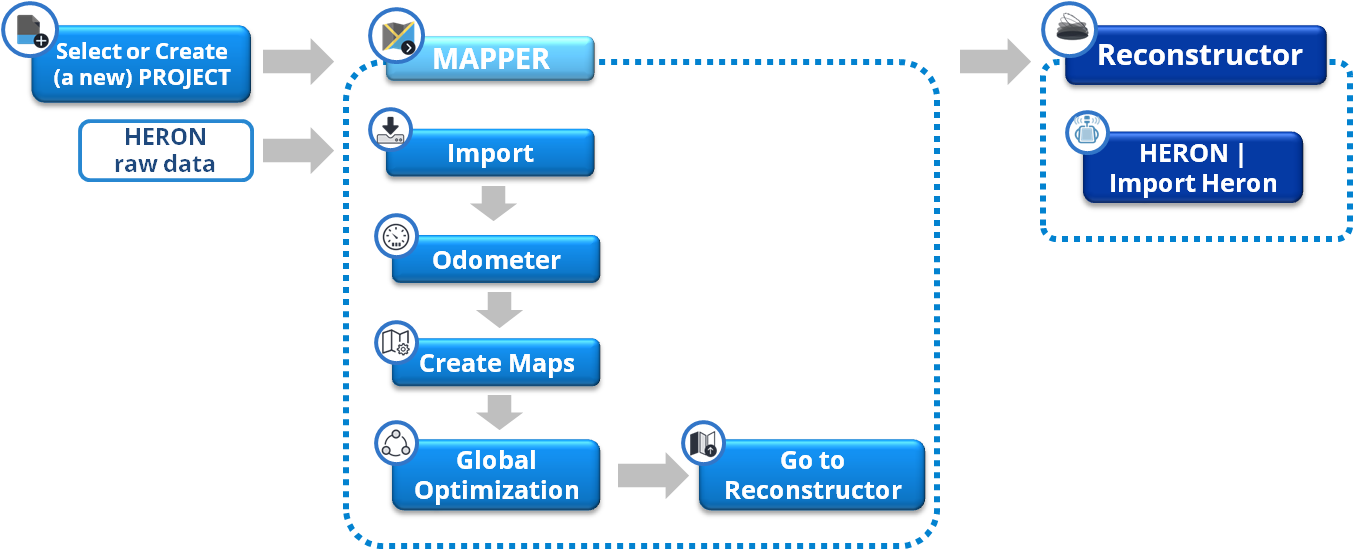
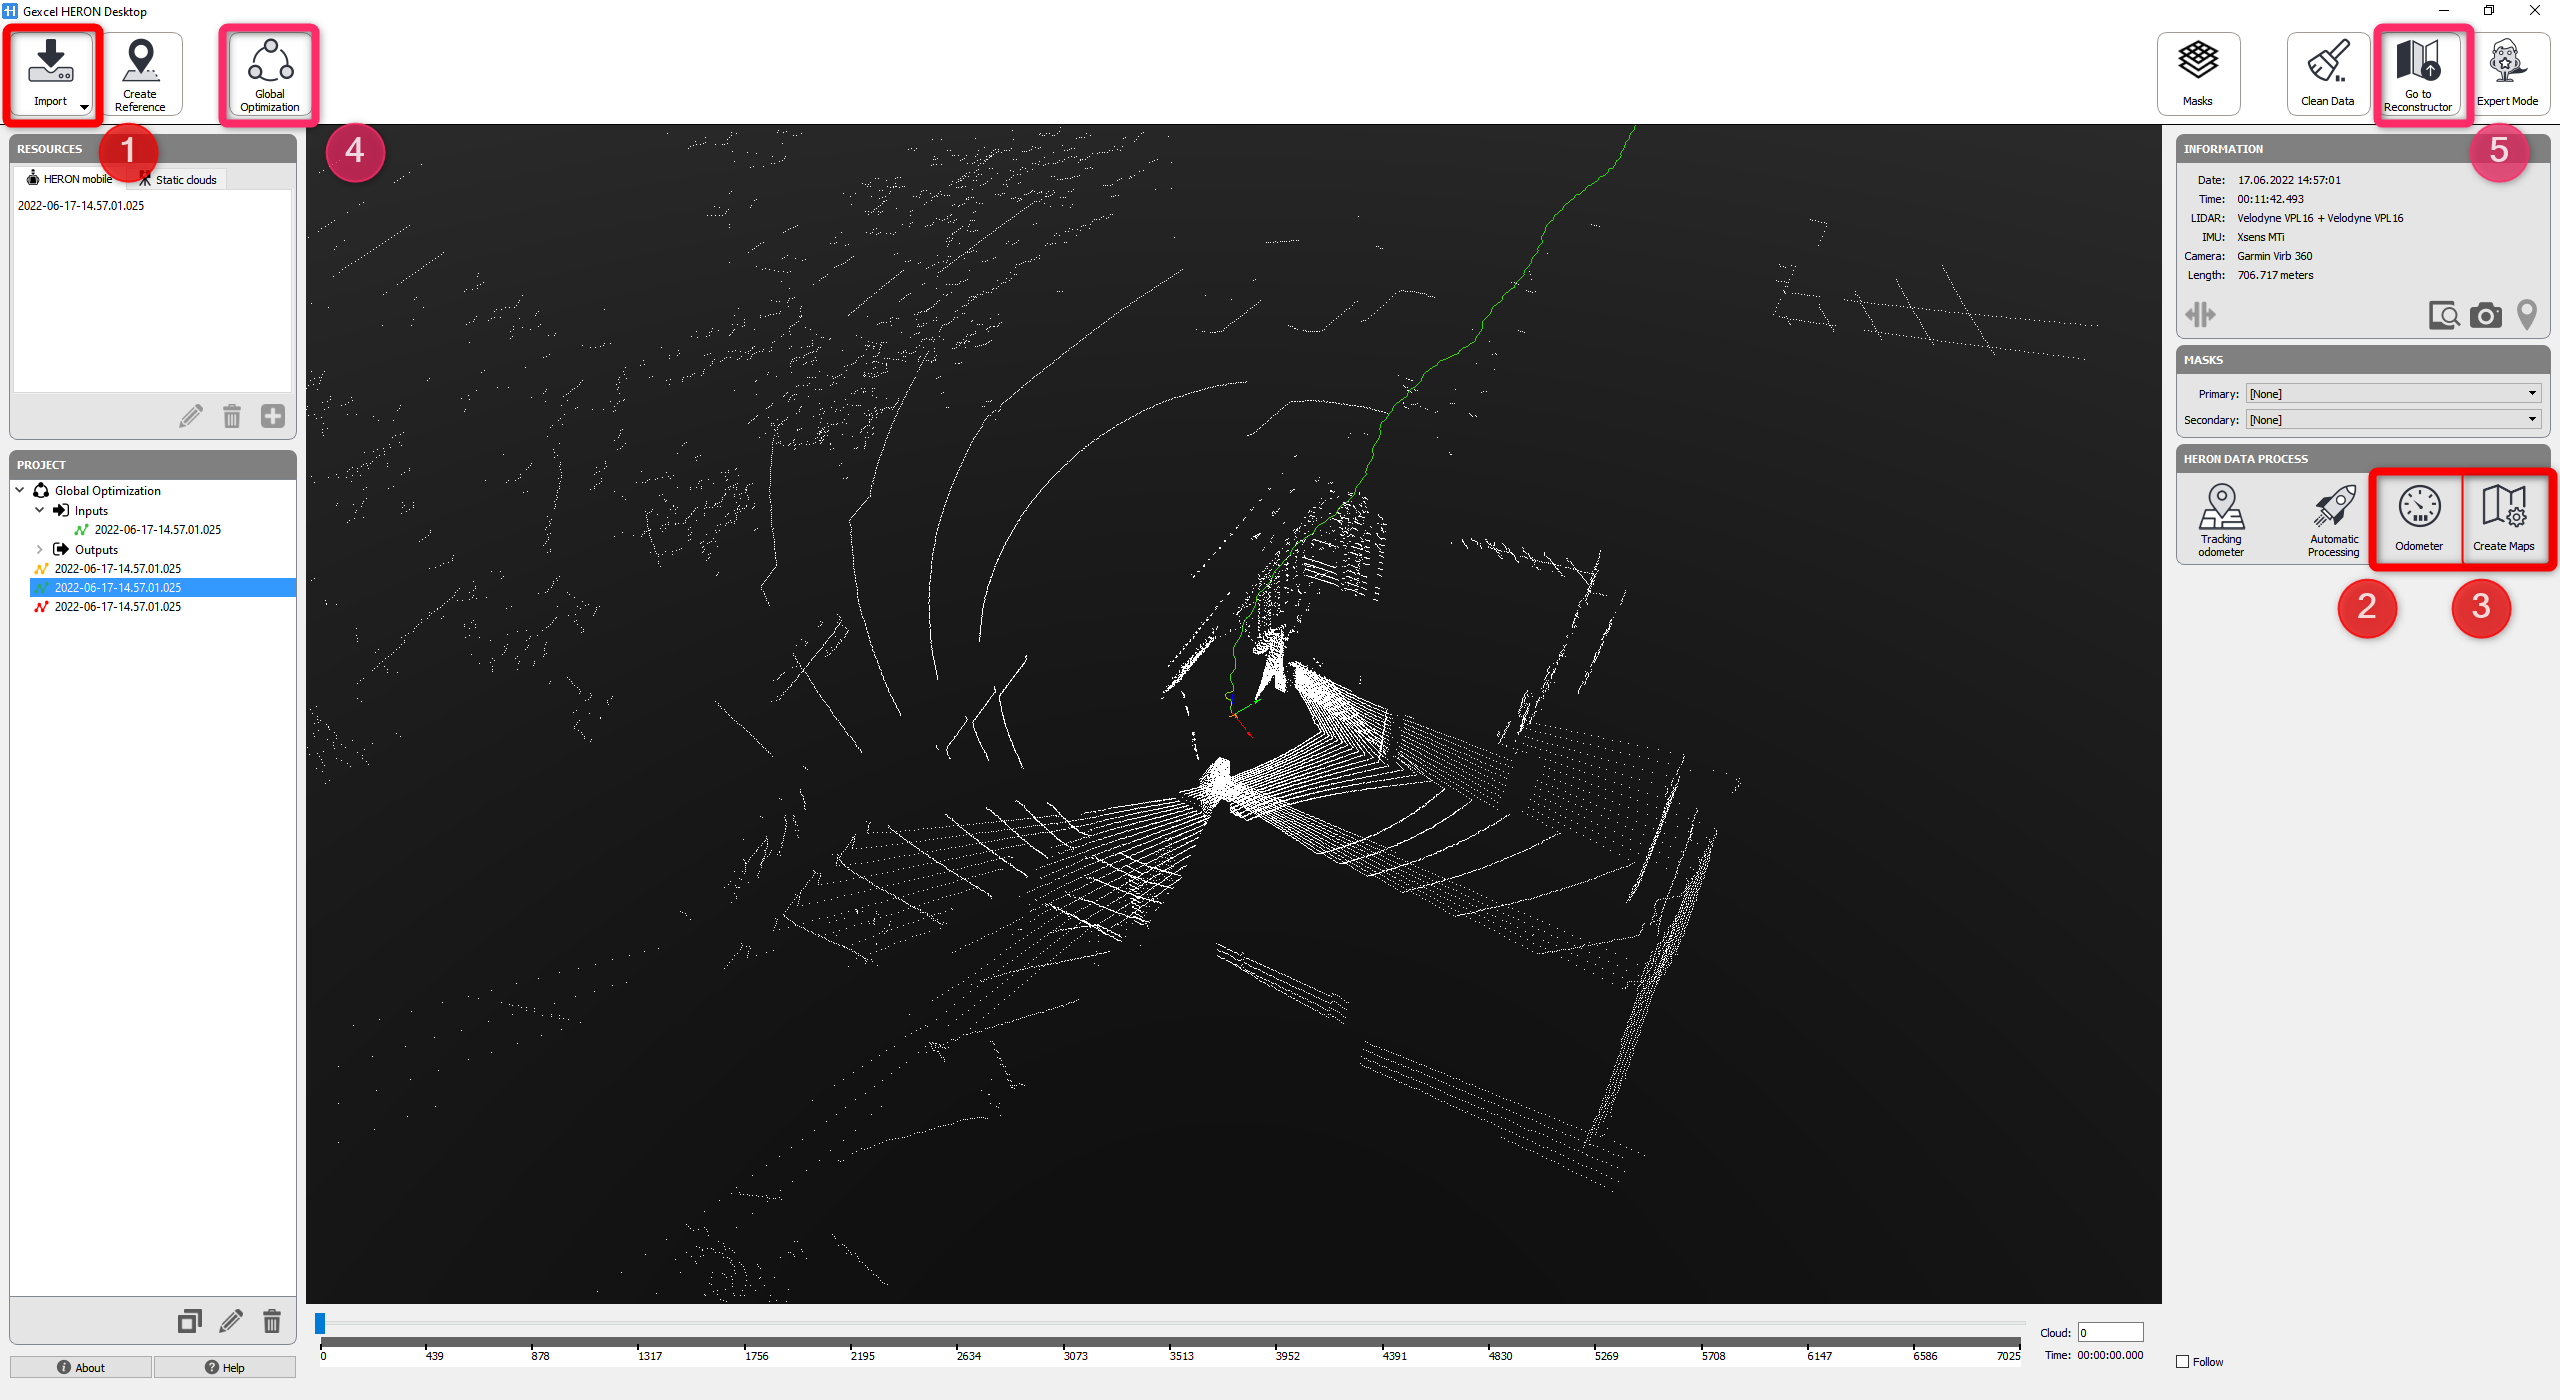
All the command positions can be easily found as shown in the image below.
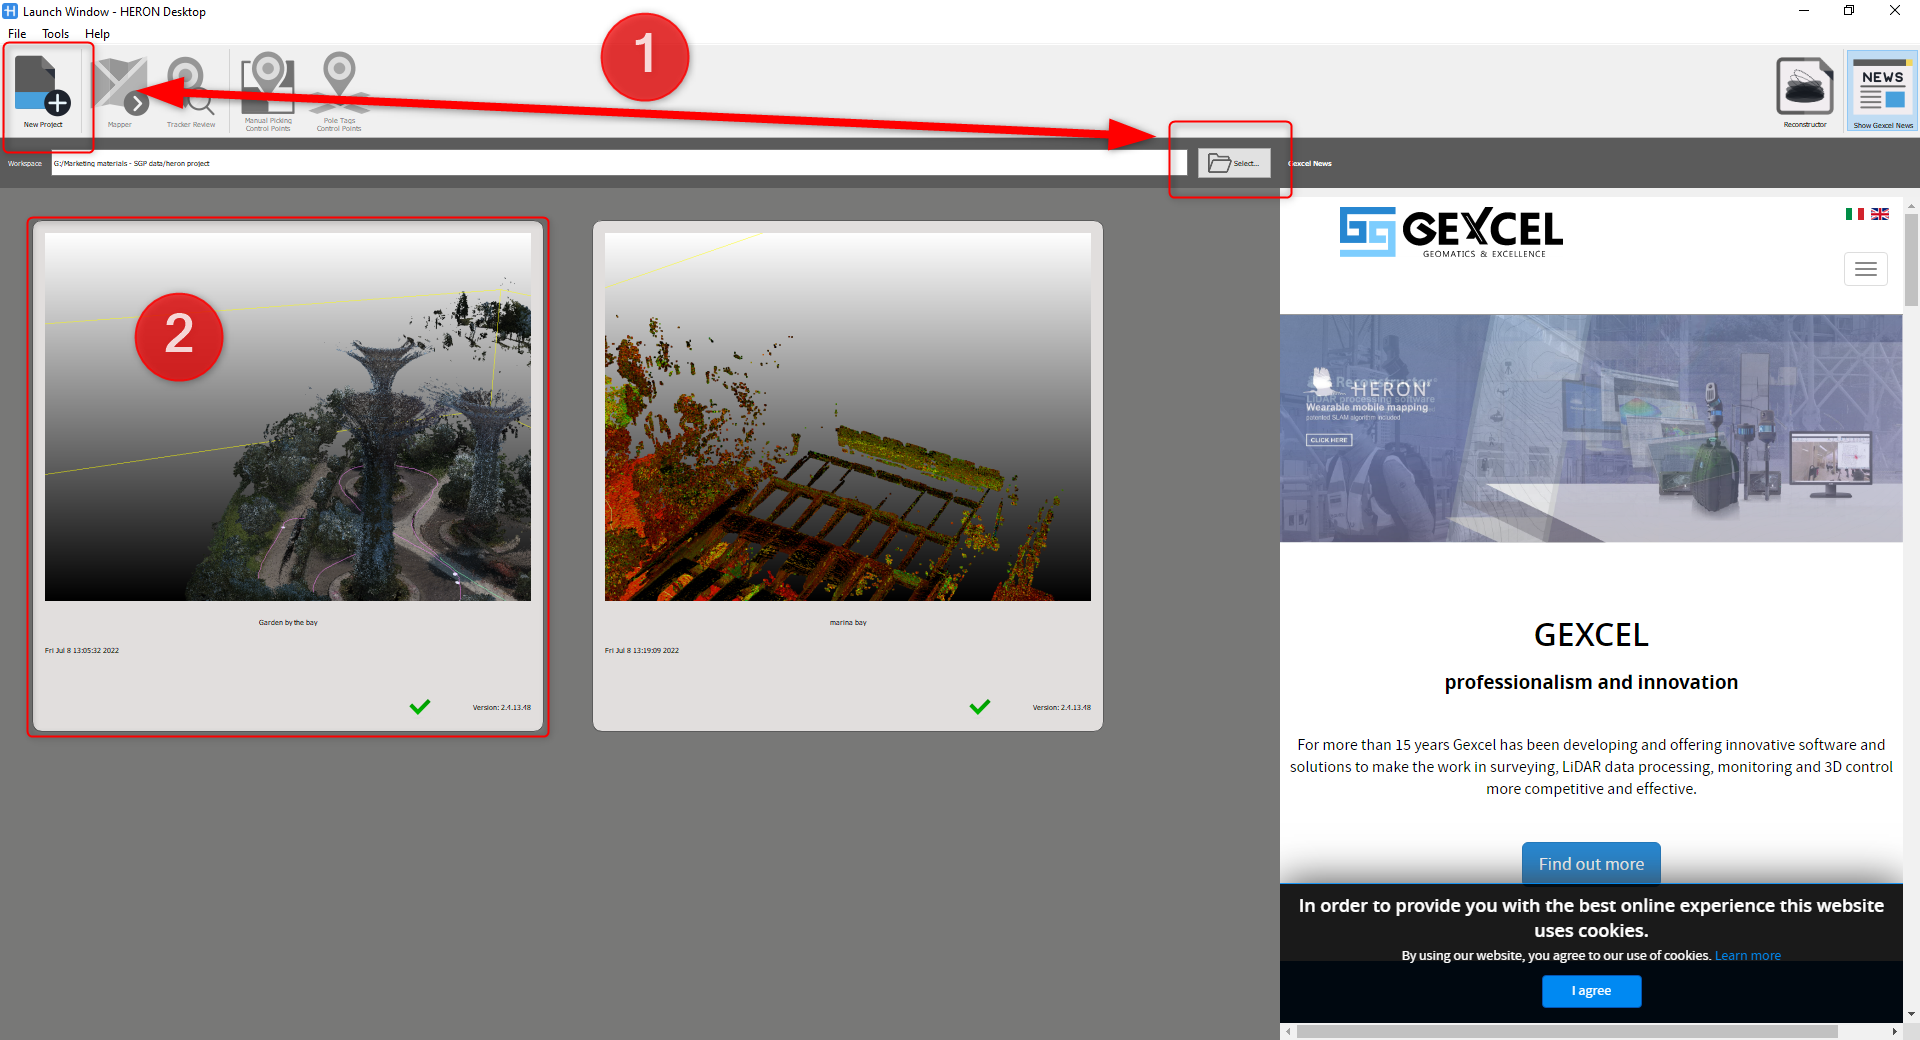
As soon as opening HERON Desktop software, to process a Heron raw data, we can define a folder in your computer which will store all the processed data or your project. It is highly recommended to create the folder on a SSD to efficiently speed up data processing process.
The following image showing how to select and/or create a new HERON desktop project or continue processing data in an existing project:
After creating and/or selecting an existing project, on the top right of HERON Desktop Workspace, click on Mapper button to go to the main workspace for data post processing.
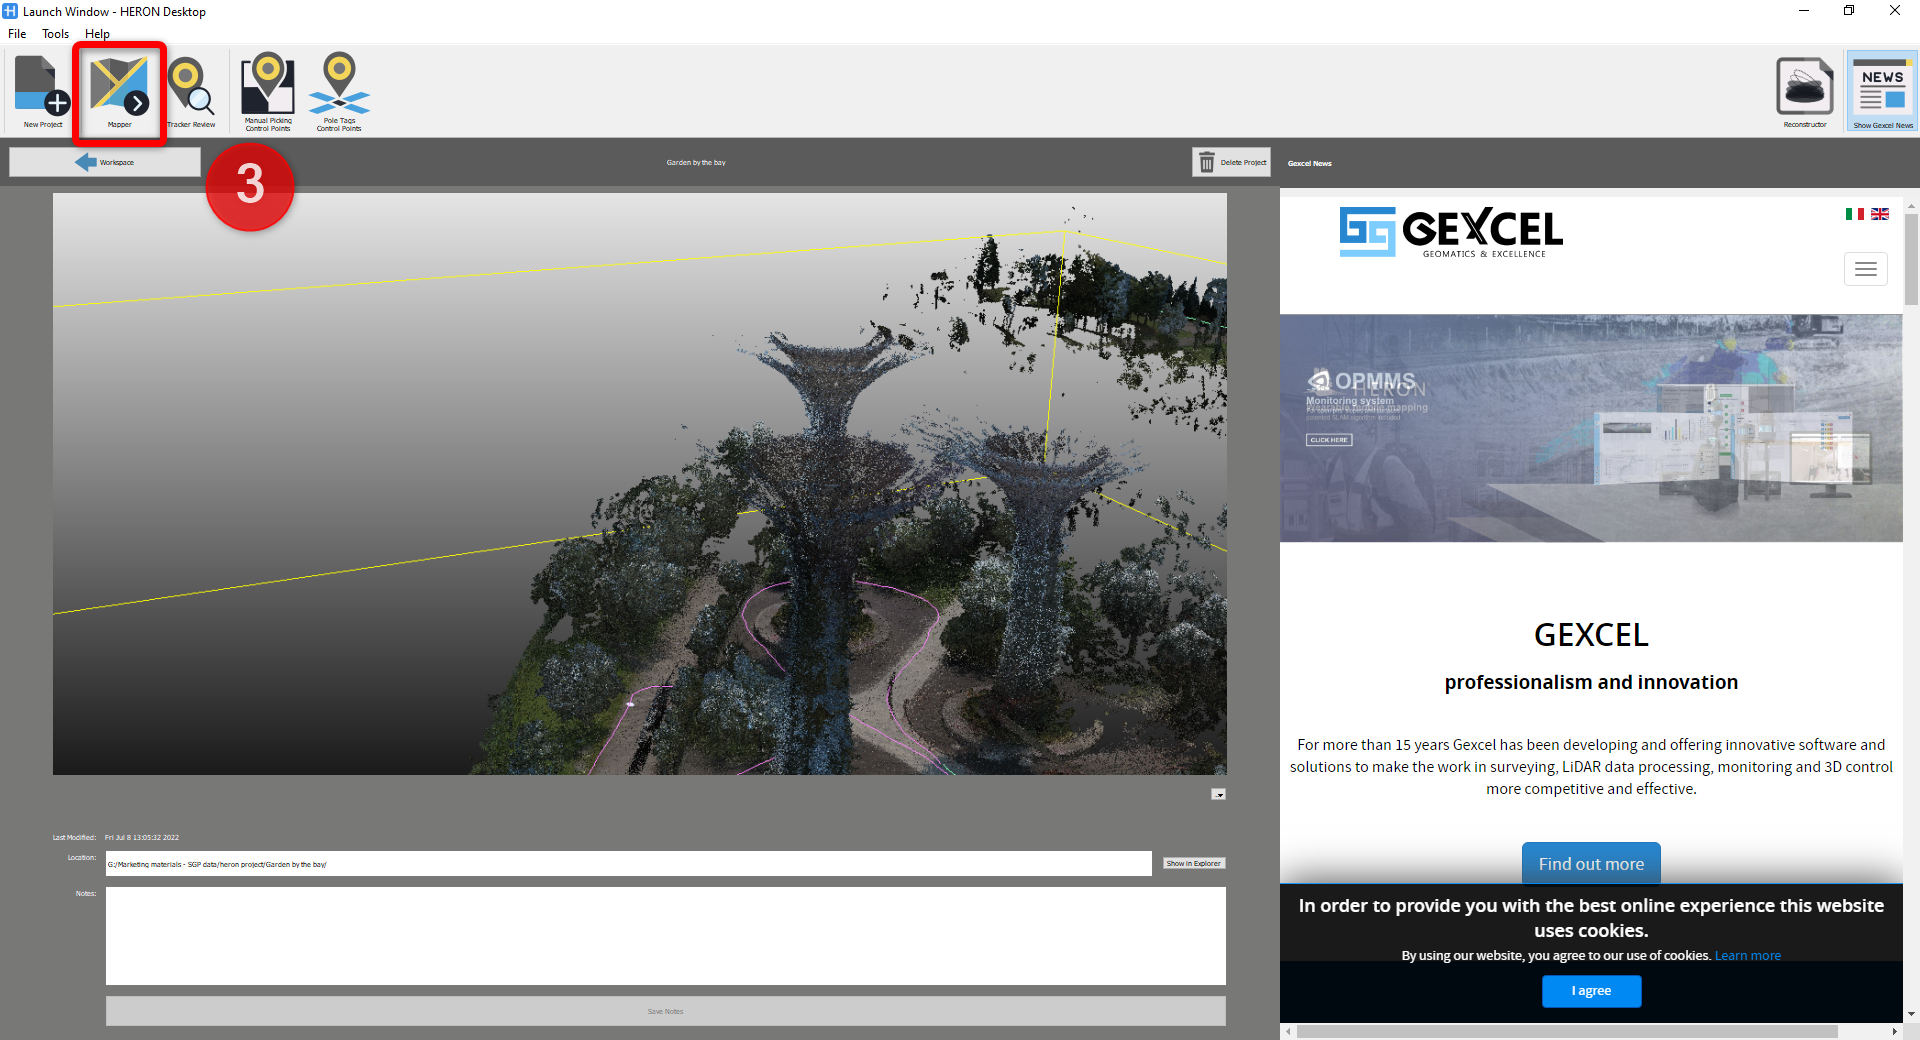
Follow the steps from 1 to 5 as shown in the image below. These steps represents the principal workflow in HERON Desktop.
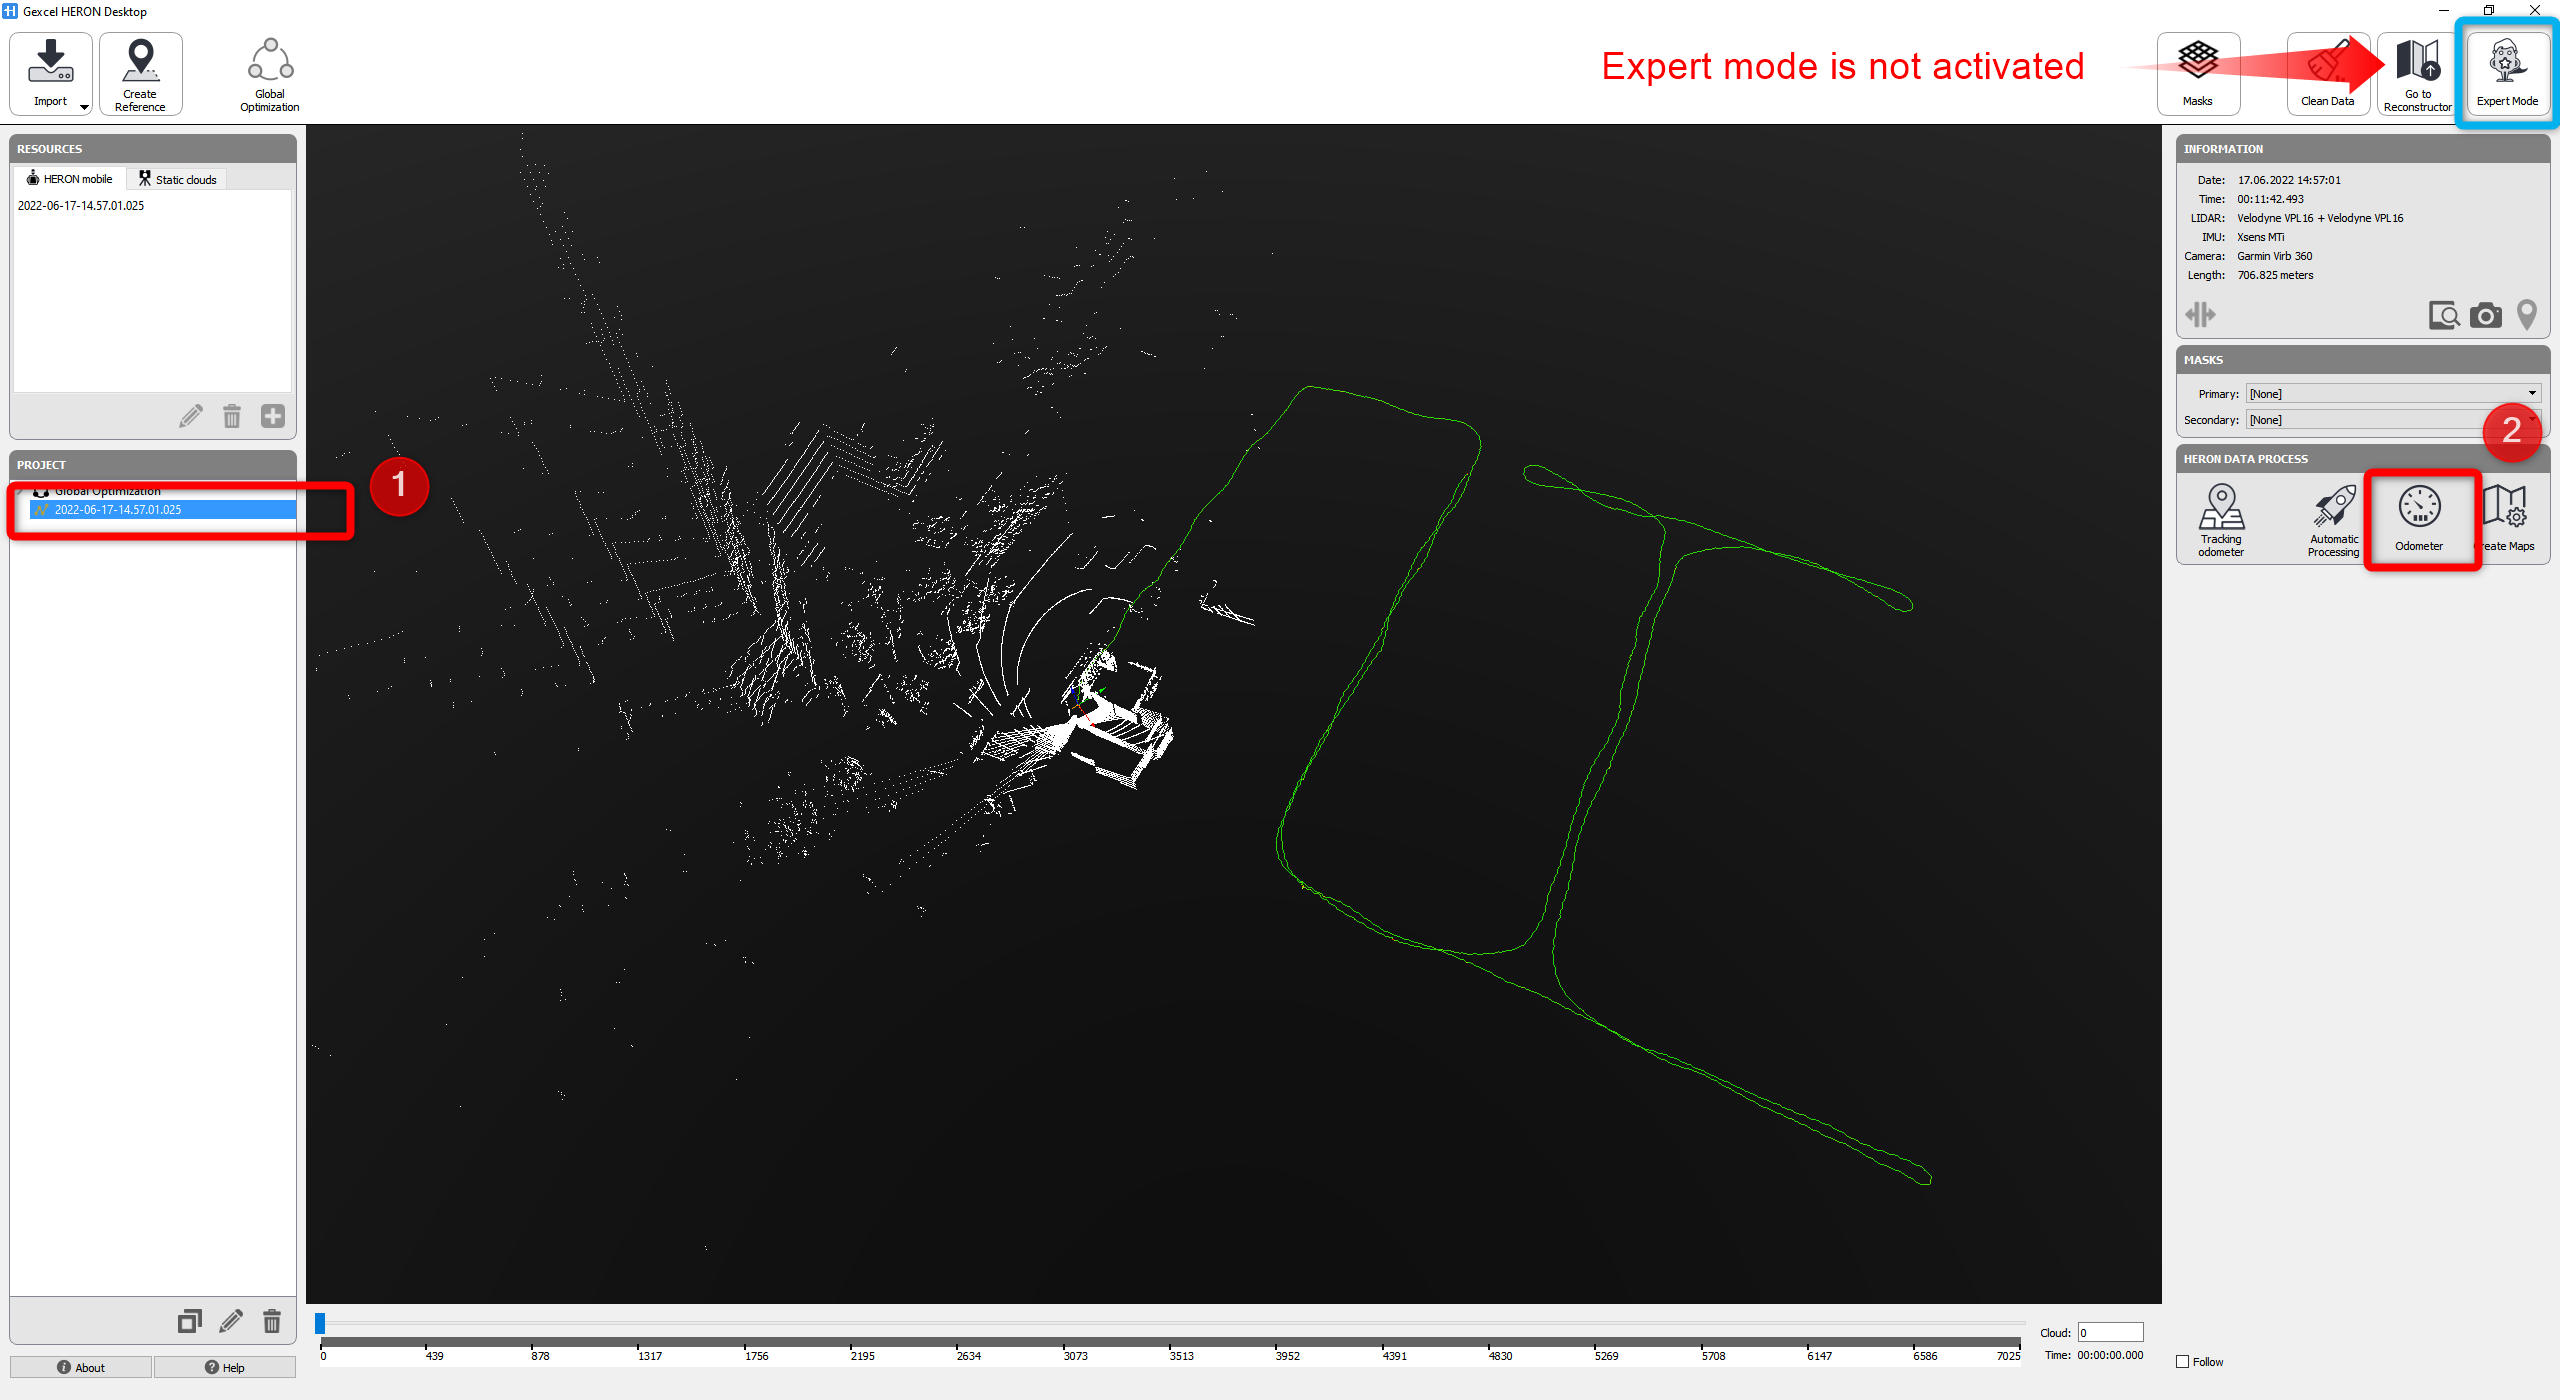
To start the trajectory processing for a single trajectory, it has to be selected from the Project window on the left of the window and start with Odometer operation,
|
|
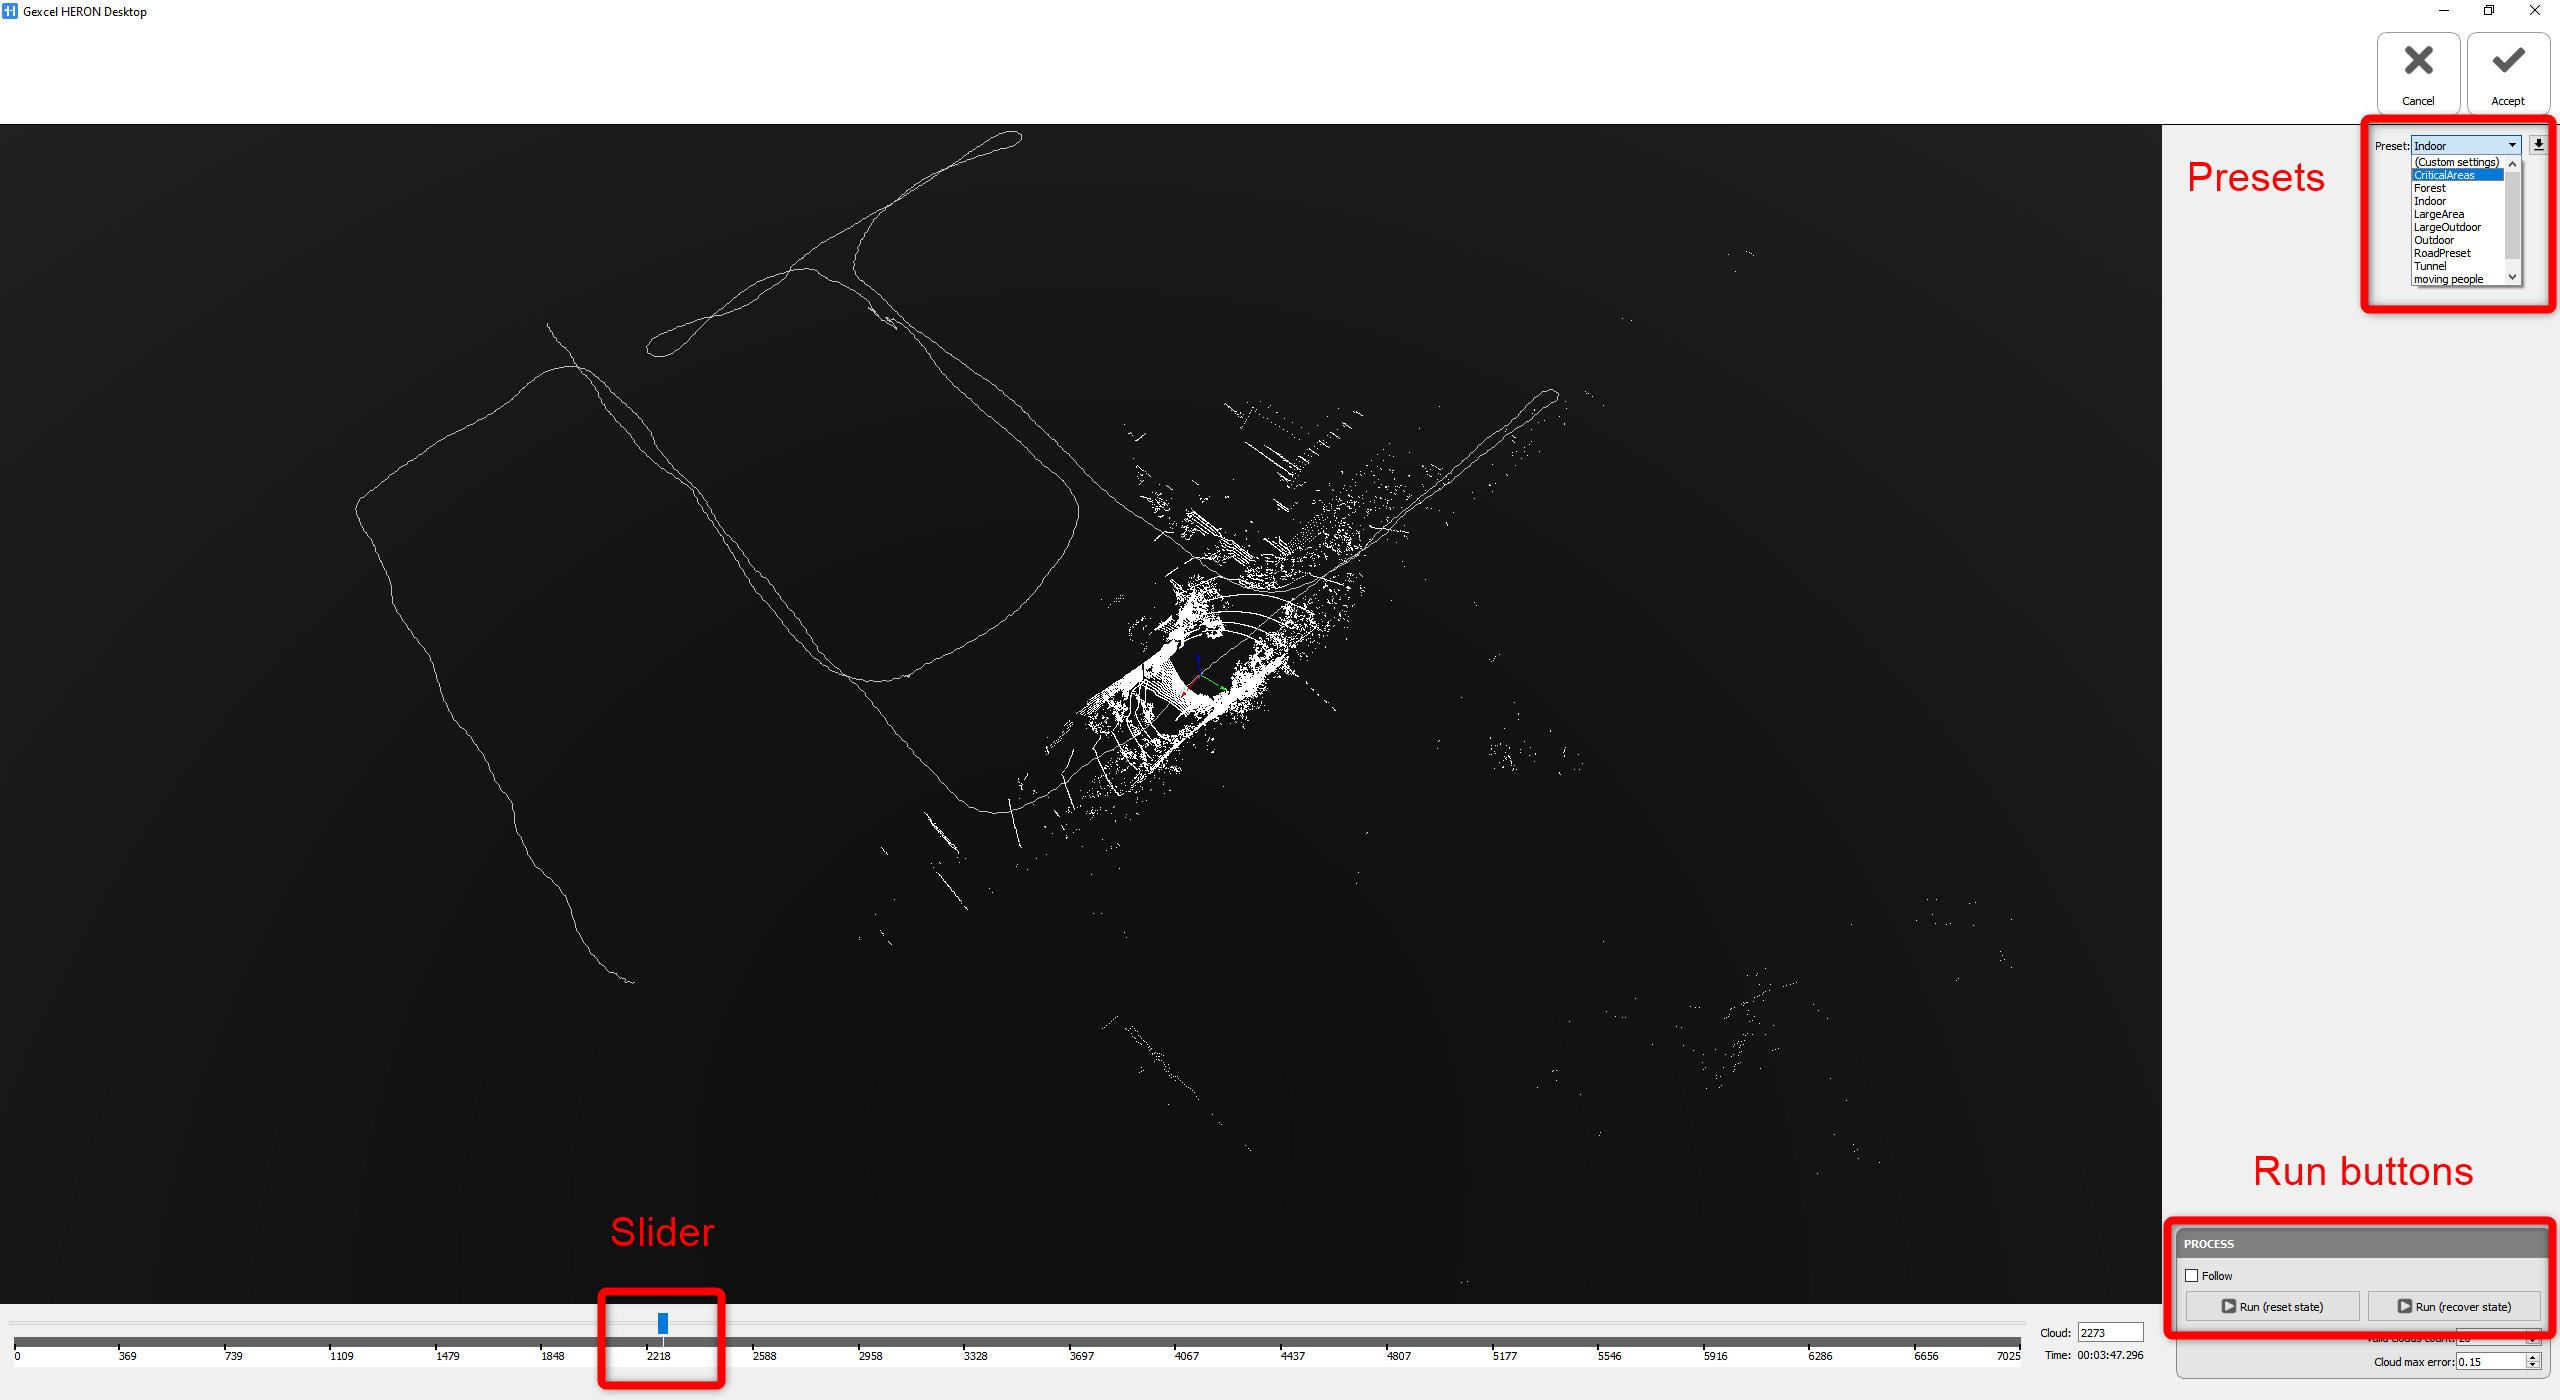
Odometer is the operation which compute or recompute the trajectory (in case the trajectory has been generated during the live acquisition) using the sequential geometrical data acquired in the field. The proposed presets guide the user to adopt the proper parameters with respect to the different characteristic of the surveyed areas. The names of the presets are indicating for survey environments which HERON® is used to acquire the data. For the Odometer presets see here
In Odometer operation, the process can be stop and Run at any time; different presets can be use along the same trajectory Using Run (reset state) to run Odometer from zero, while following the process, if you might detect a drift, you can stop the process => move the slider back and use Run (recover state) |

Once the Odometer is done, click on ![]() at the top right to get back to the main workspace.
at the top right to get back to the main workspace.
|
|
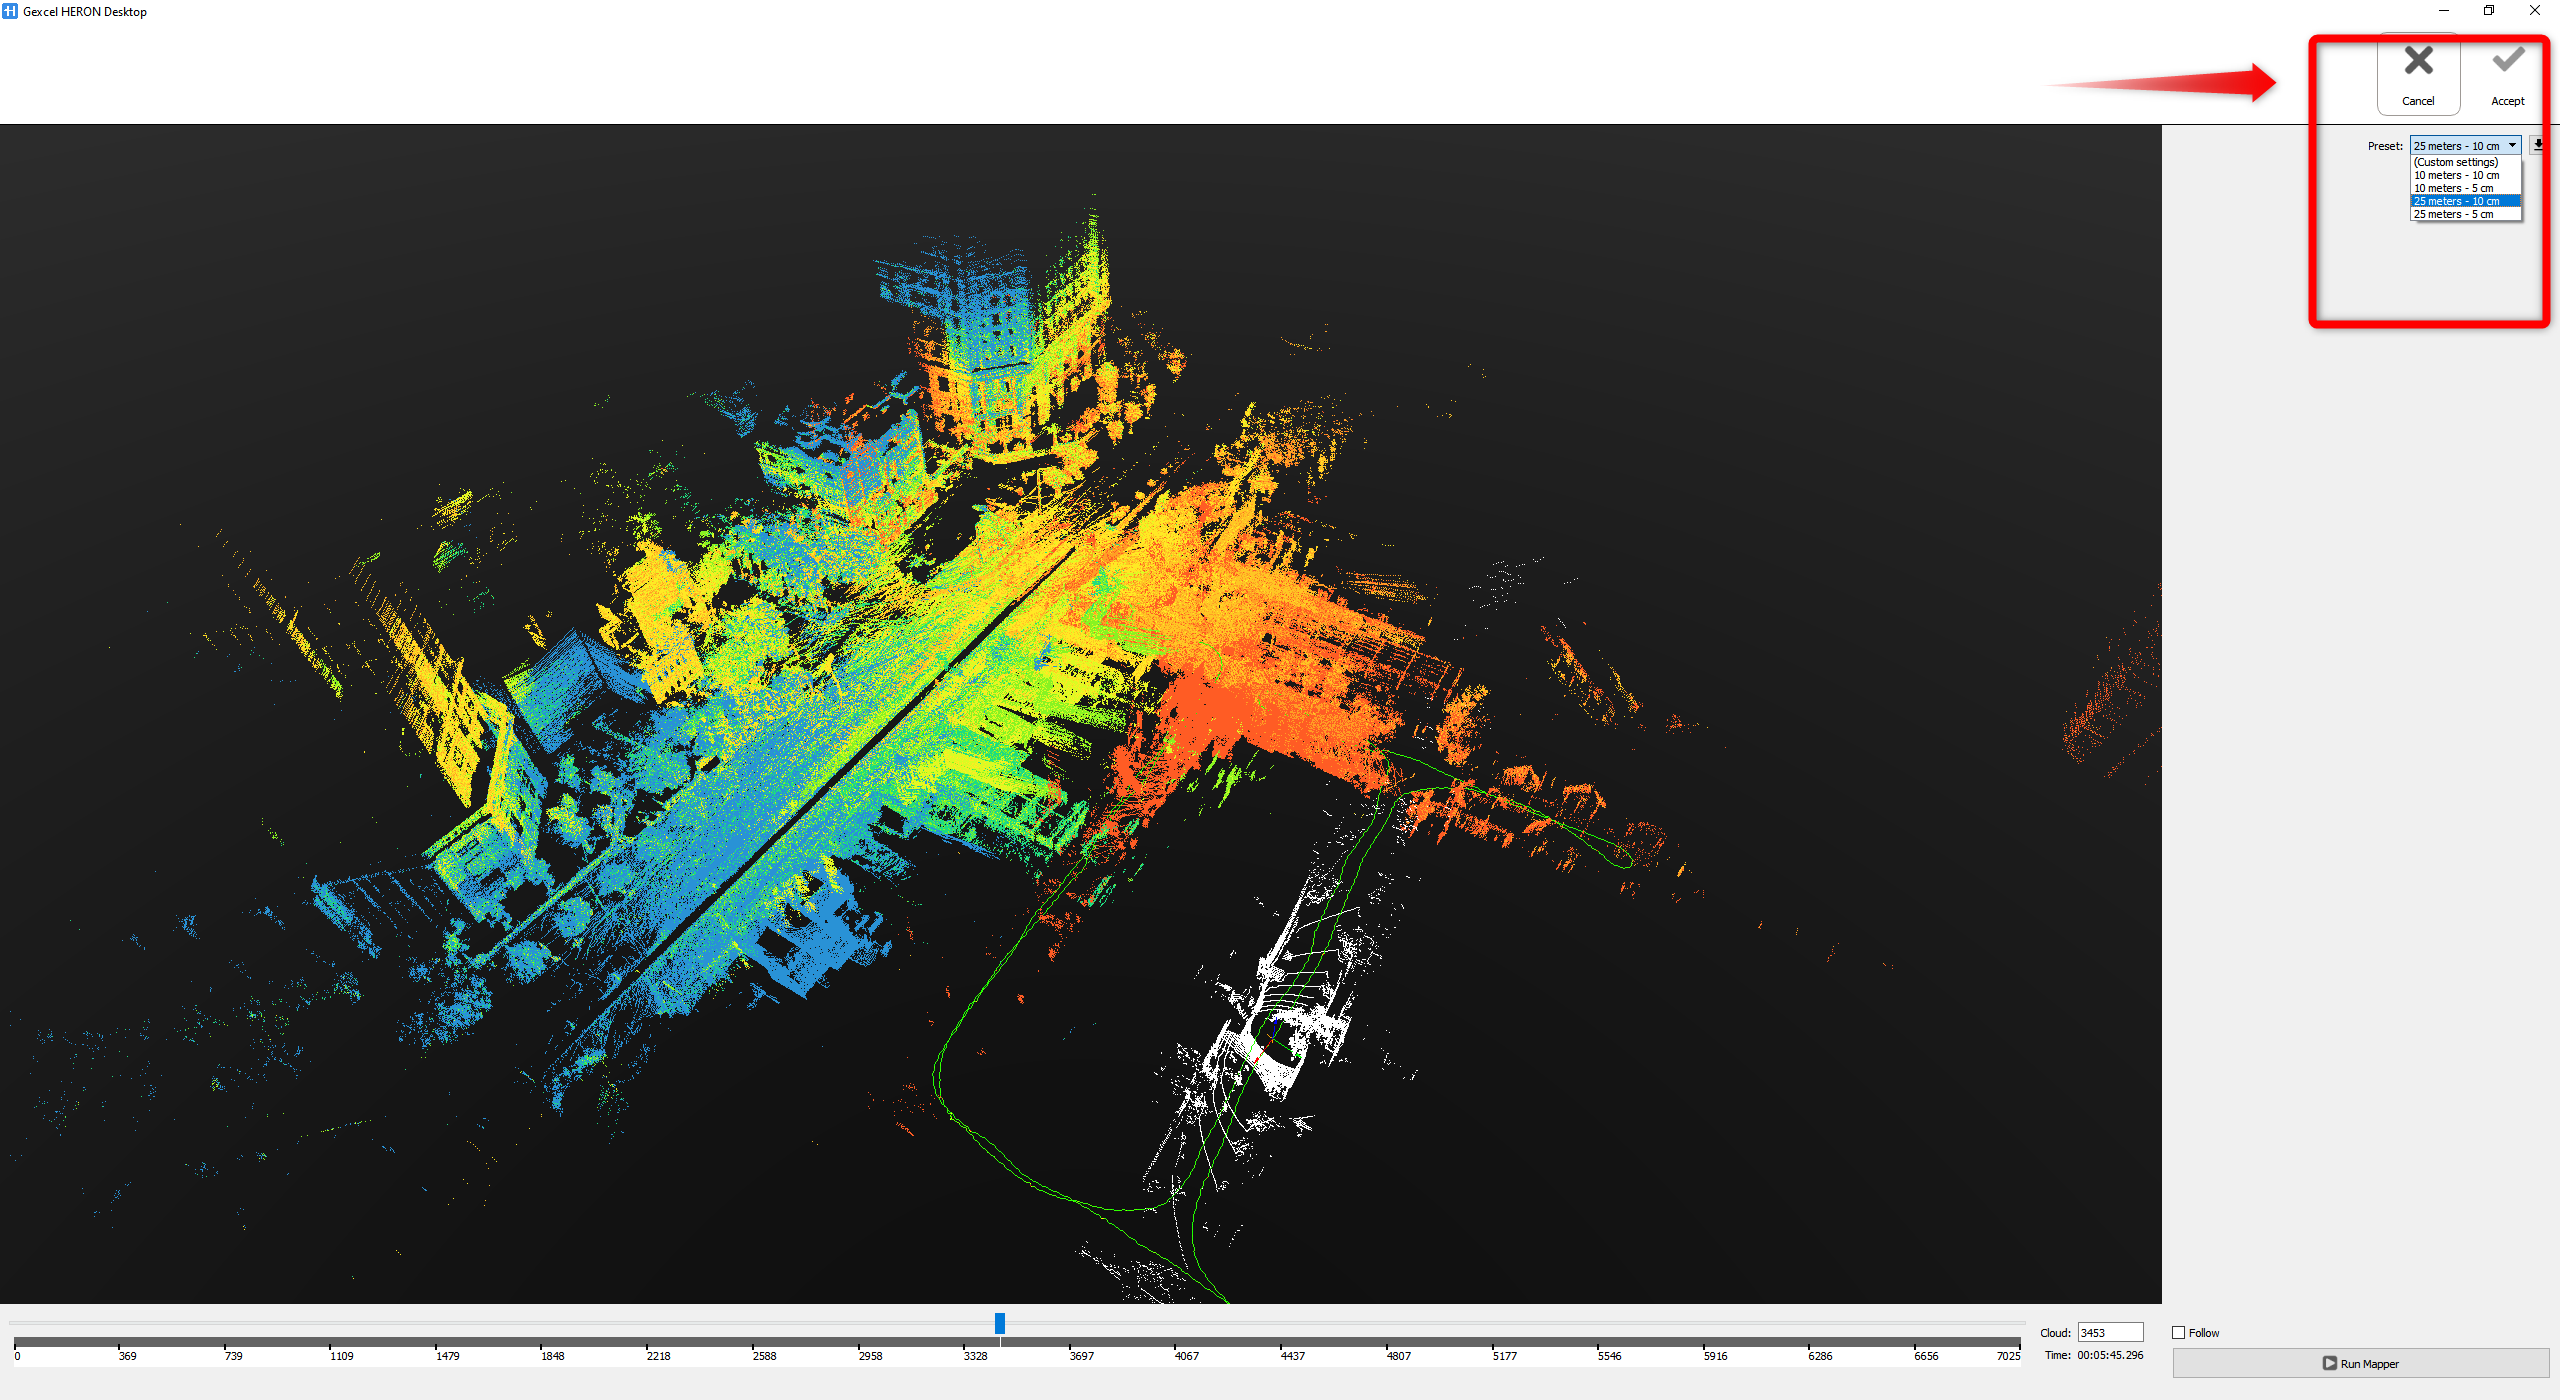
Create Maps is the next step in the workflow. In this step the software will divide the complete HERON® trajectory into chunks, called Local Maps.. The proposed presets, on the top right of the workspace, define the size and the resolution the Local Maps
These local maps then will be used in the next step, Global Optimization, to minimize the residual drifts of HERON® Surveys. For the Mapper presets see here. |

|
|
Global Optimization is the final step which globally optimize HERON® survey minimizing the residual drifts In the Global Optimization, there are 2 presets which are Standard and Standard Gravity. For the Global Optimization presets see also here When using Standard Gravity, HERON Desktop applies the IMU gravity estimation to levelling the final point cloud. When Global Optimization command is selected, all the local maps of a single trajectory are grouped in cluster and connected each other along the trajectory path.
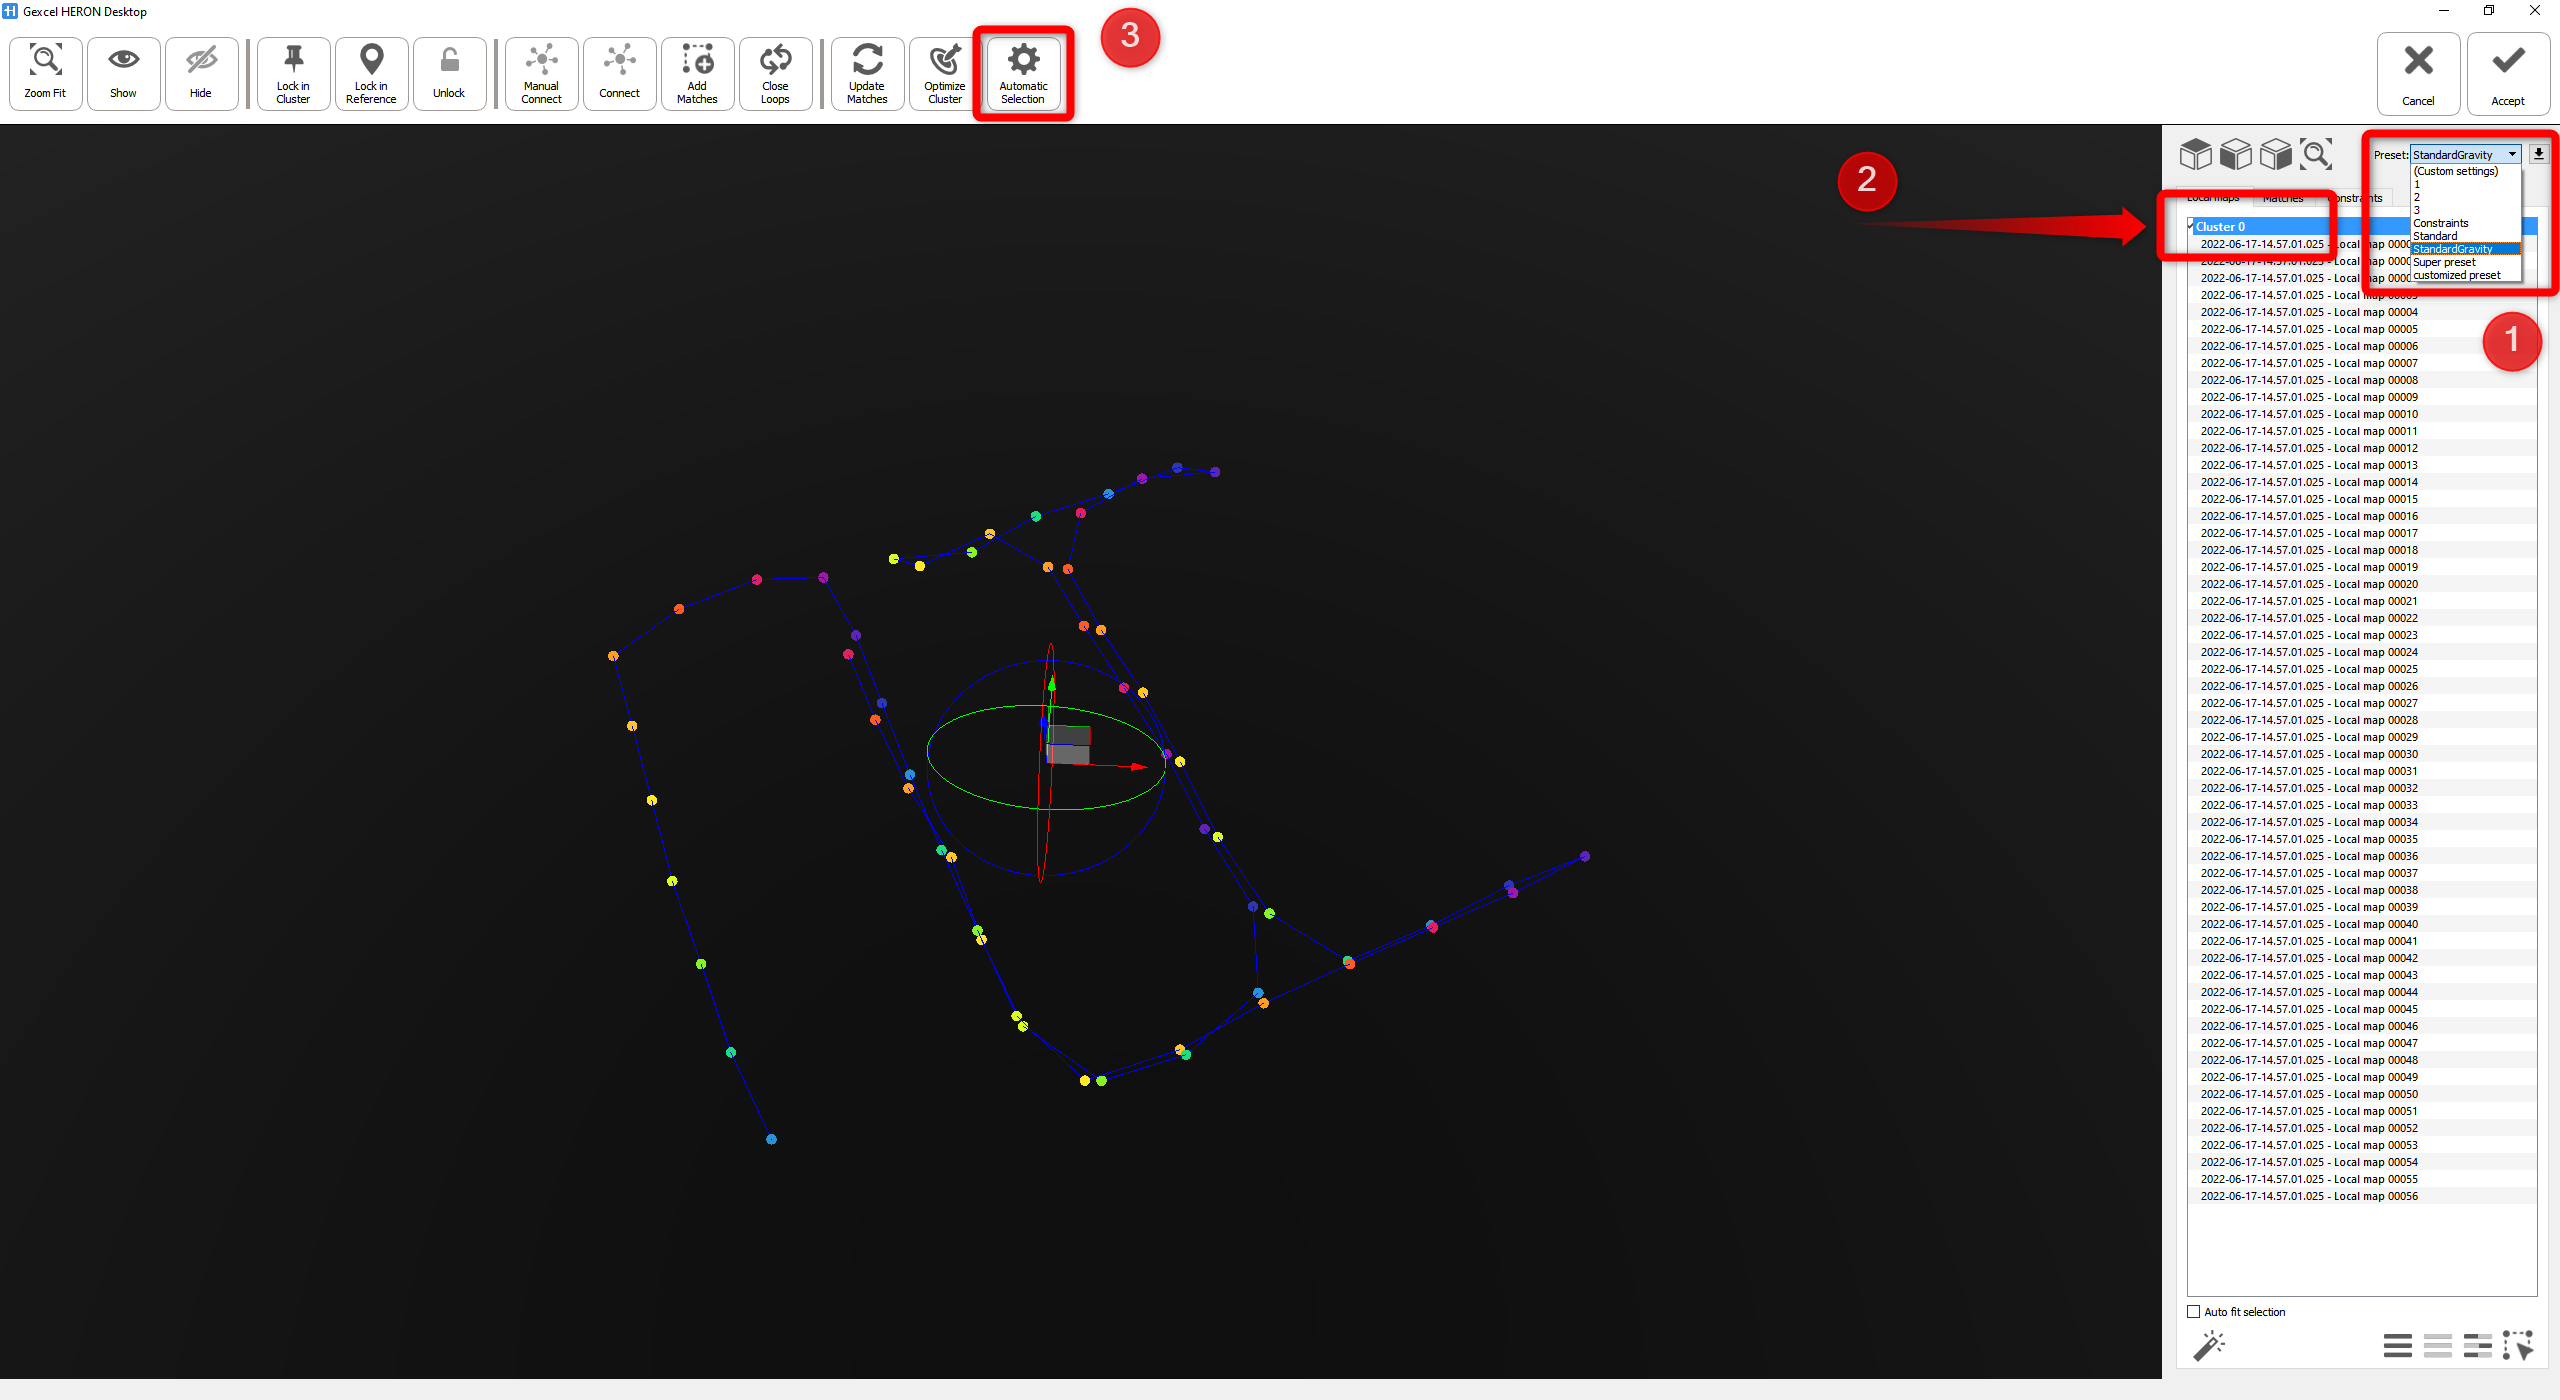
Scope of the Global Optimization is to create new and robust connection between overlapping local maps and to minimize the global registration error between the local m In the window on the right (Local maps tab) , select Cluster from the list to select all the local maps Then run Automatic Selection to let the software automatically generate connections between all the overlapping local maps; This function automatically create new connection, align the maps and optimize the final network of connections minimizing the errors. |

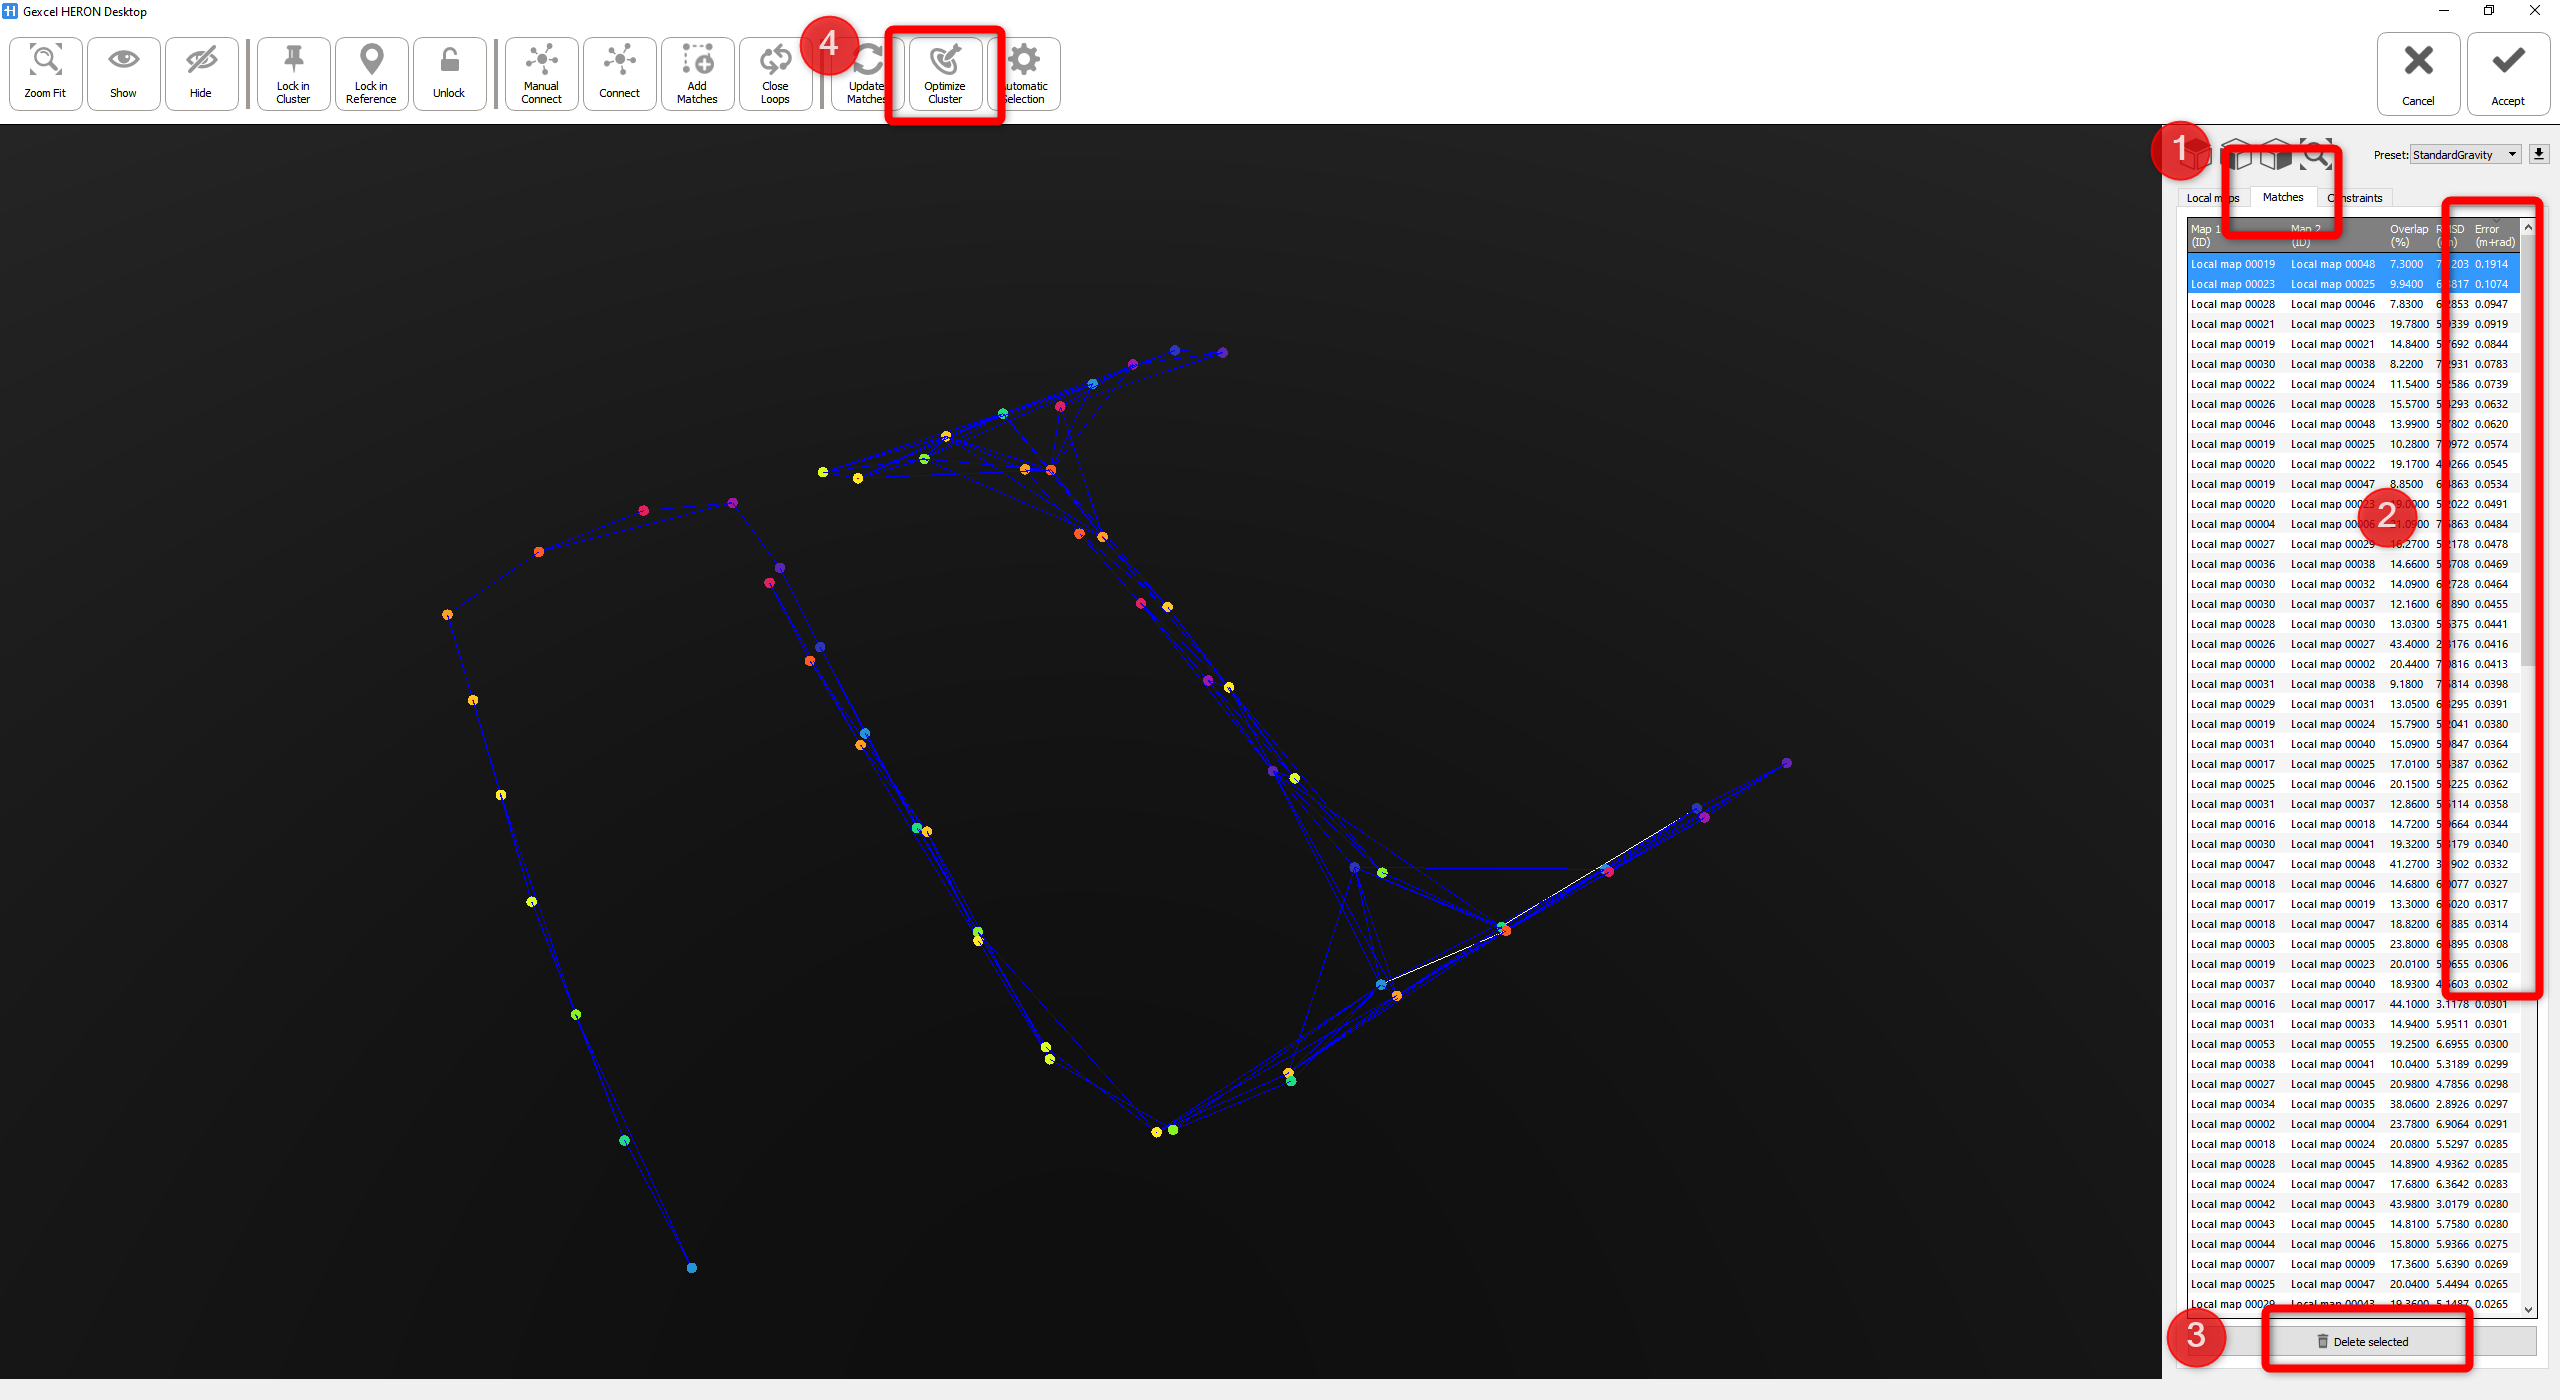
After the Automatic Selection process is done, go to the Matches tab and click on Error column to sort the errors in decreasing order. Select and delete all the matches which have value bigger than 0.1 (or 10cm). In expert mode you can find more details about the criteria to select and refined your matches
Then click on Optimize Cluster to again globally optimize the entire data.
Click on  to finish the operation and get back to the main workspace.
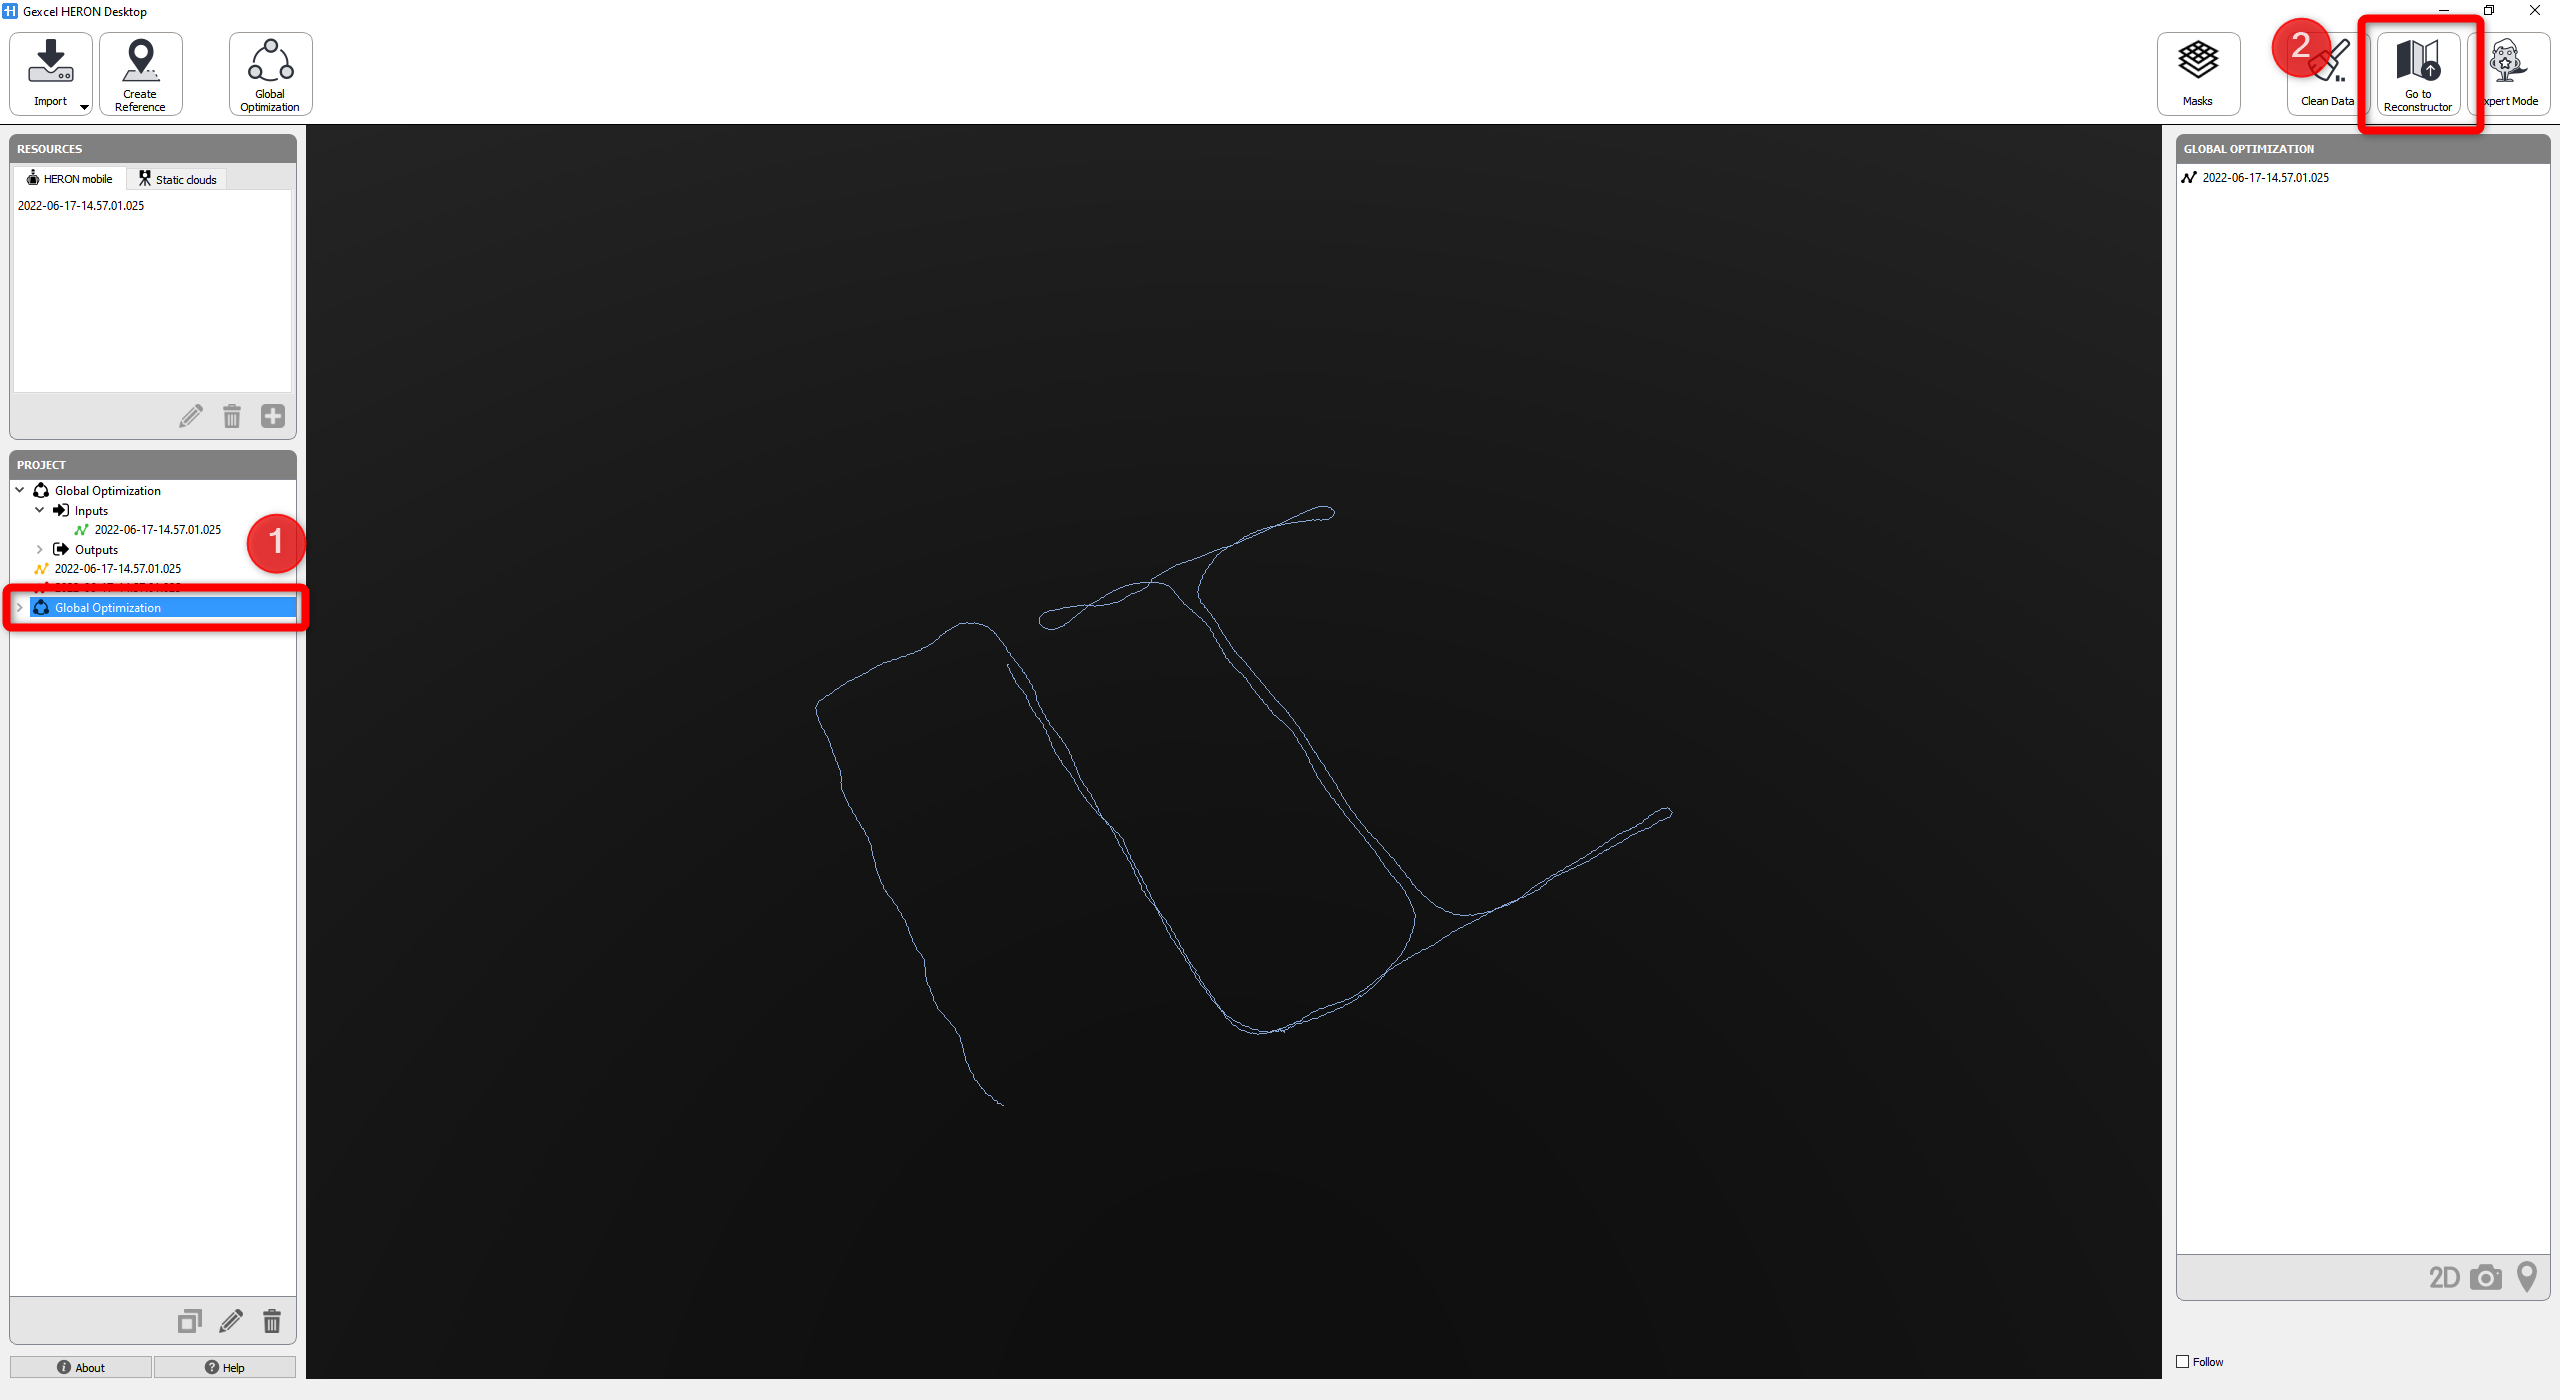
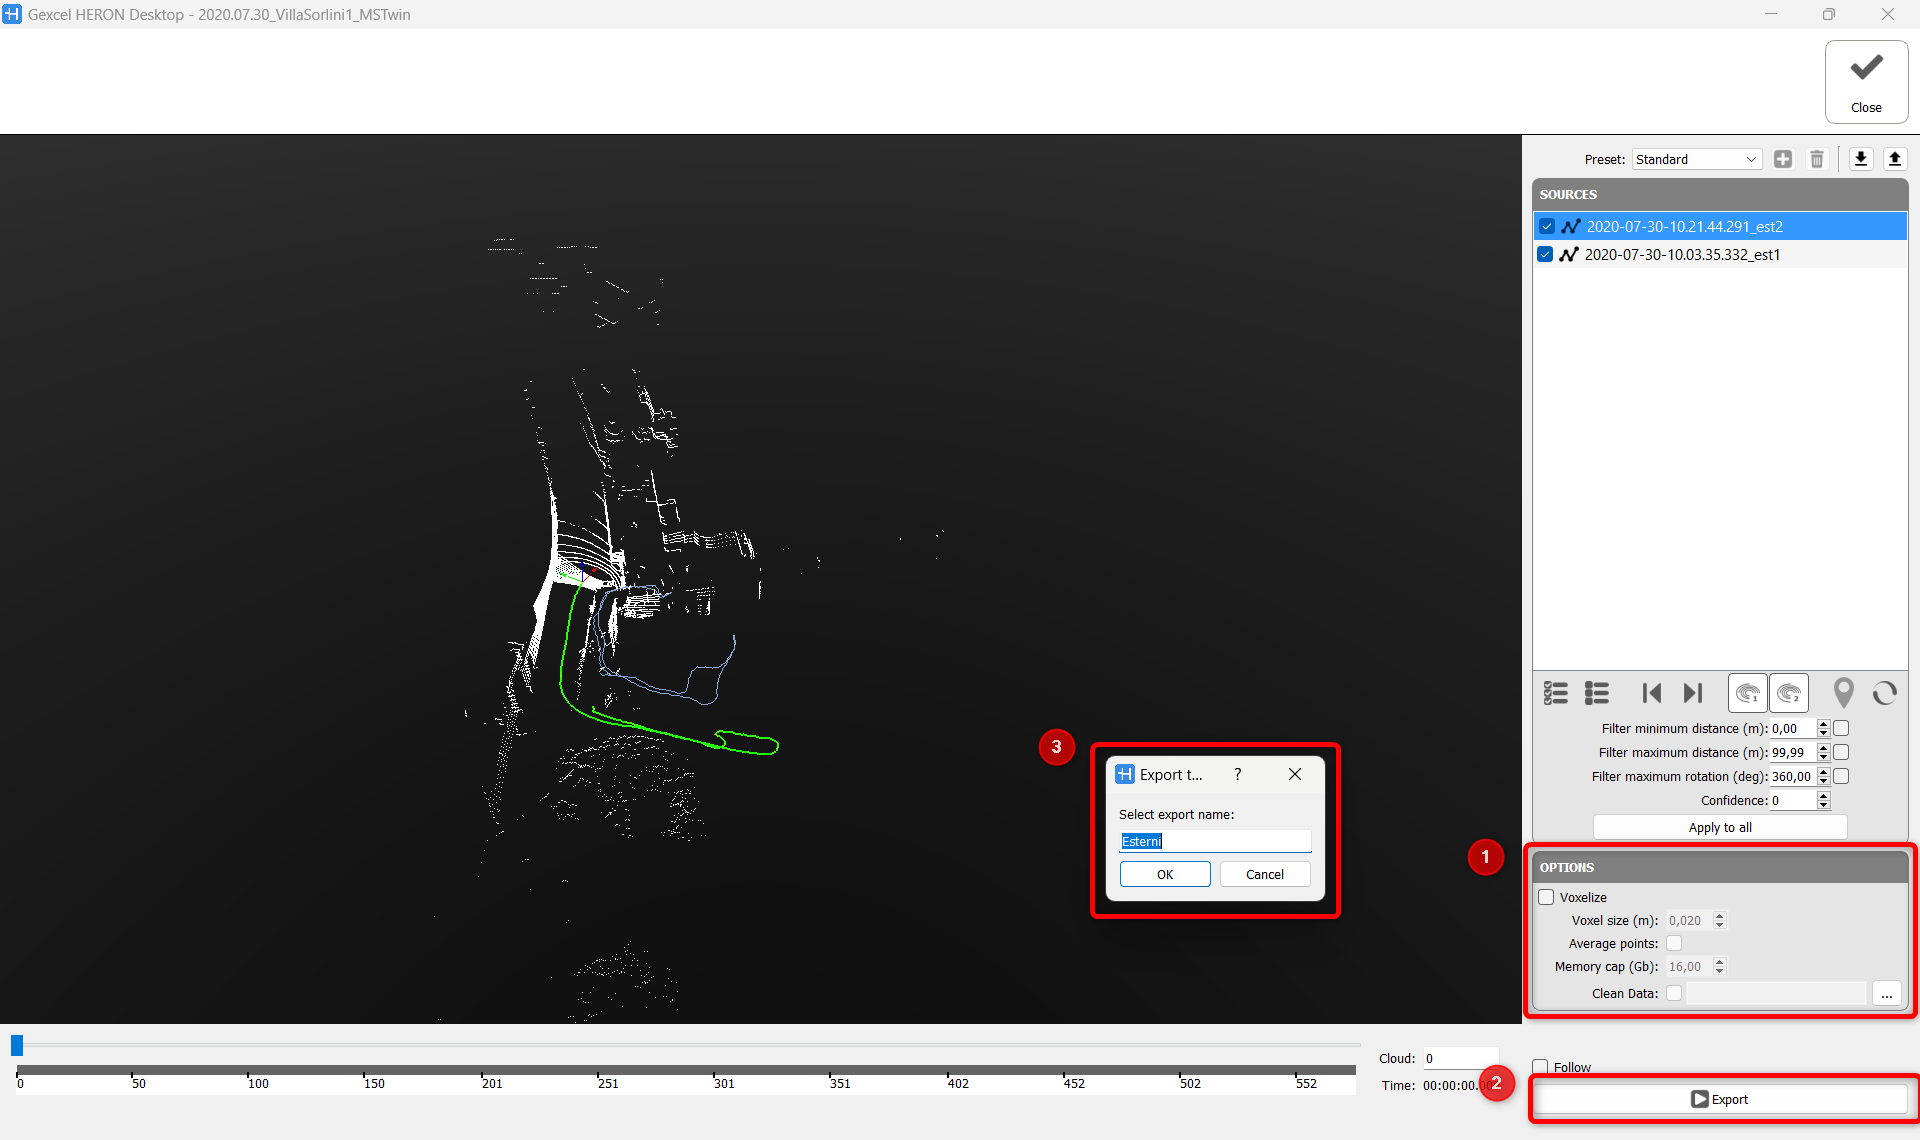
Now the data is ready to be exported. Select the Global optimization and click on Go to Recontructor to export the data.
Run the export button  , name the project and click OK to start exporting (by default in the export OPTIONS the default the Voxelize tab in disabled, for details on these options see here).
For each trajectory different export parameter can be set (sensor, range gate, images and trajectory sections).
For details on these options see here.
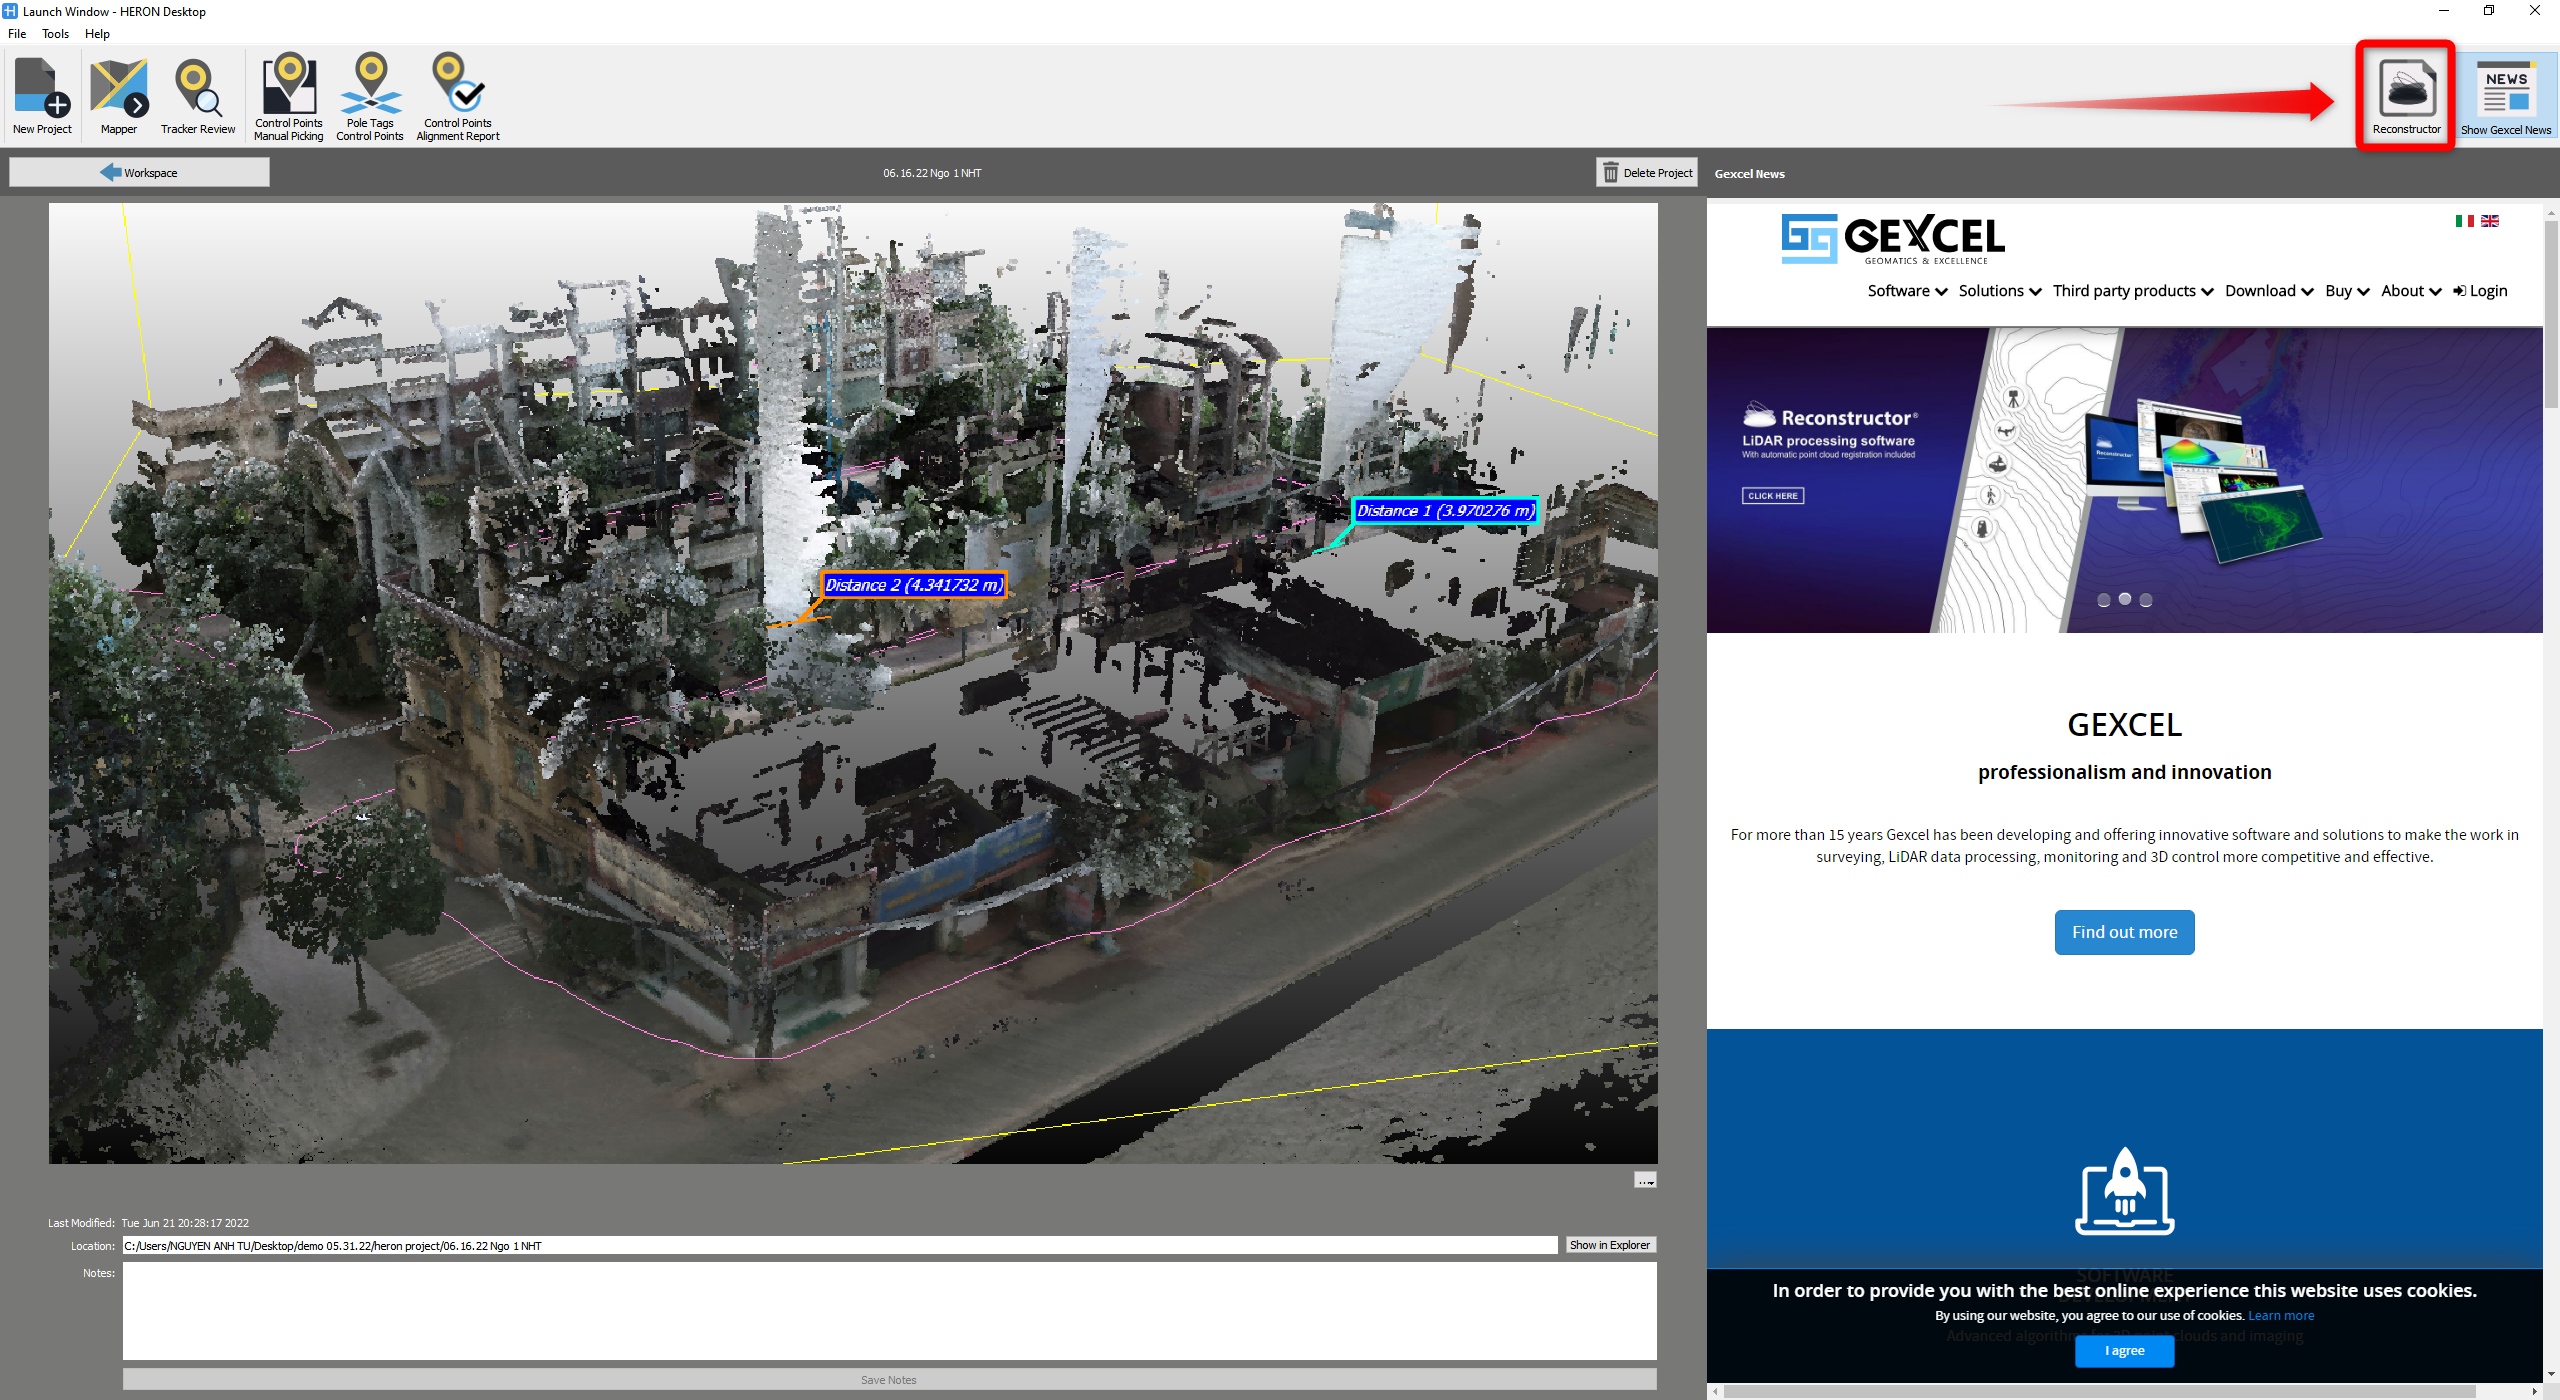
After exporting process is done, close the workspace to get back to Launch Window, click on ![]() Reconstructor button to create an empty the Reconstructor® project and open it.
Reconstructor button to create an empty the Reconstructor® project and open it.
When Reconstructor is opened, go to HERON® toolbox, find Import Heron button on the left of the toolbar and in Import Heron Data window, click on Import Global Optimization/Single trajectory to select the data to import from the drop-down list. All the components of this HERON® trajectory will be listed on the left window. Chose the default options and click Import button to start importing into Reconstructor®.
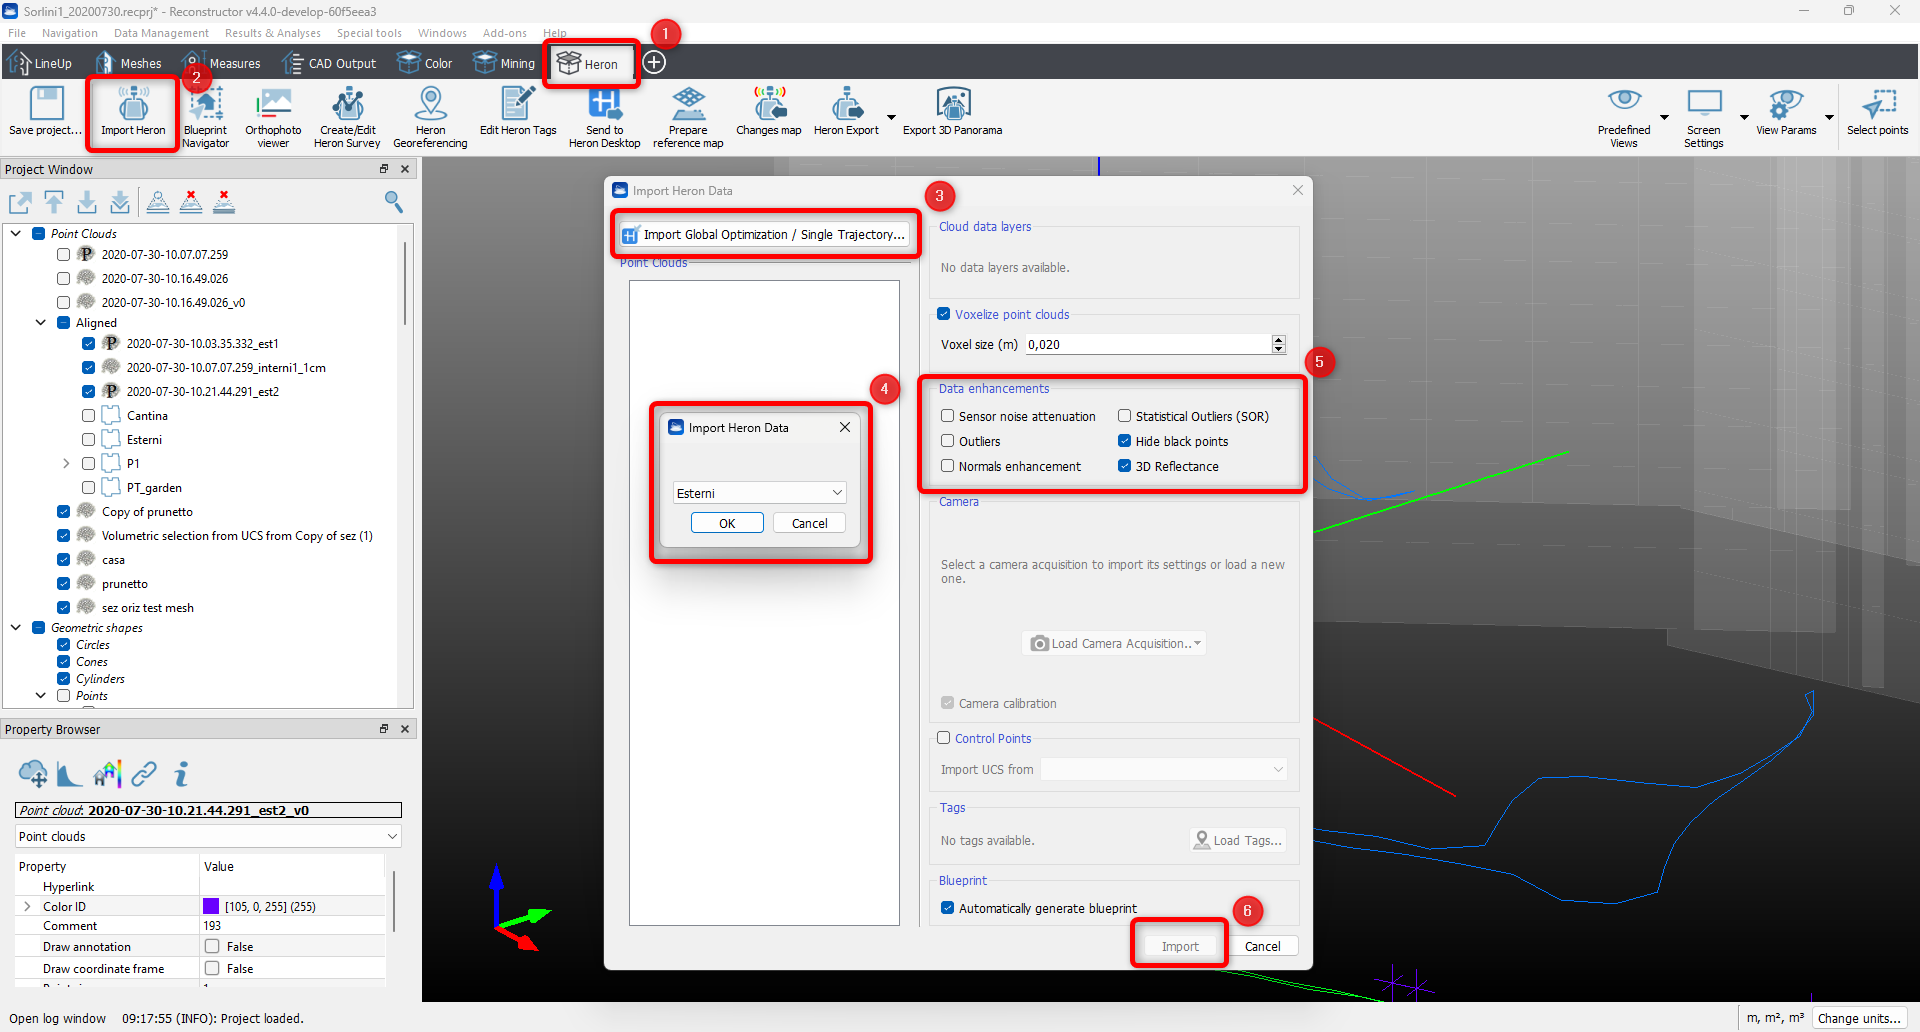
Once the import process ends, in Project Window under the Project folder, the exported Global optimization is available. This object includes: point cloud, trajectory, and a blueprint of the whole HERON® survey.
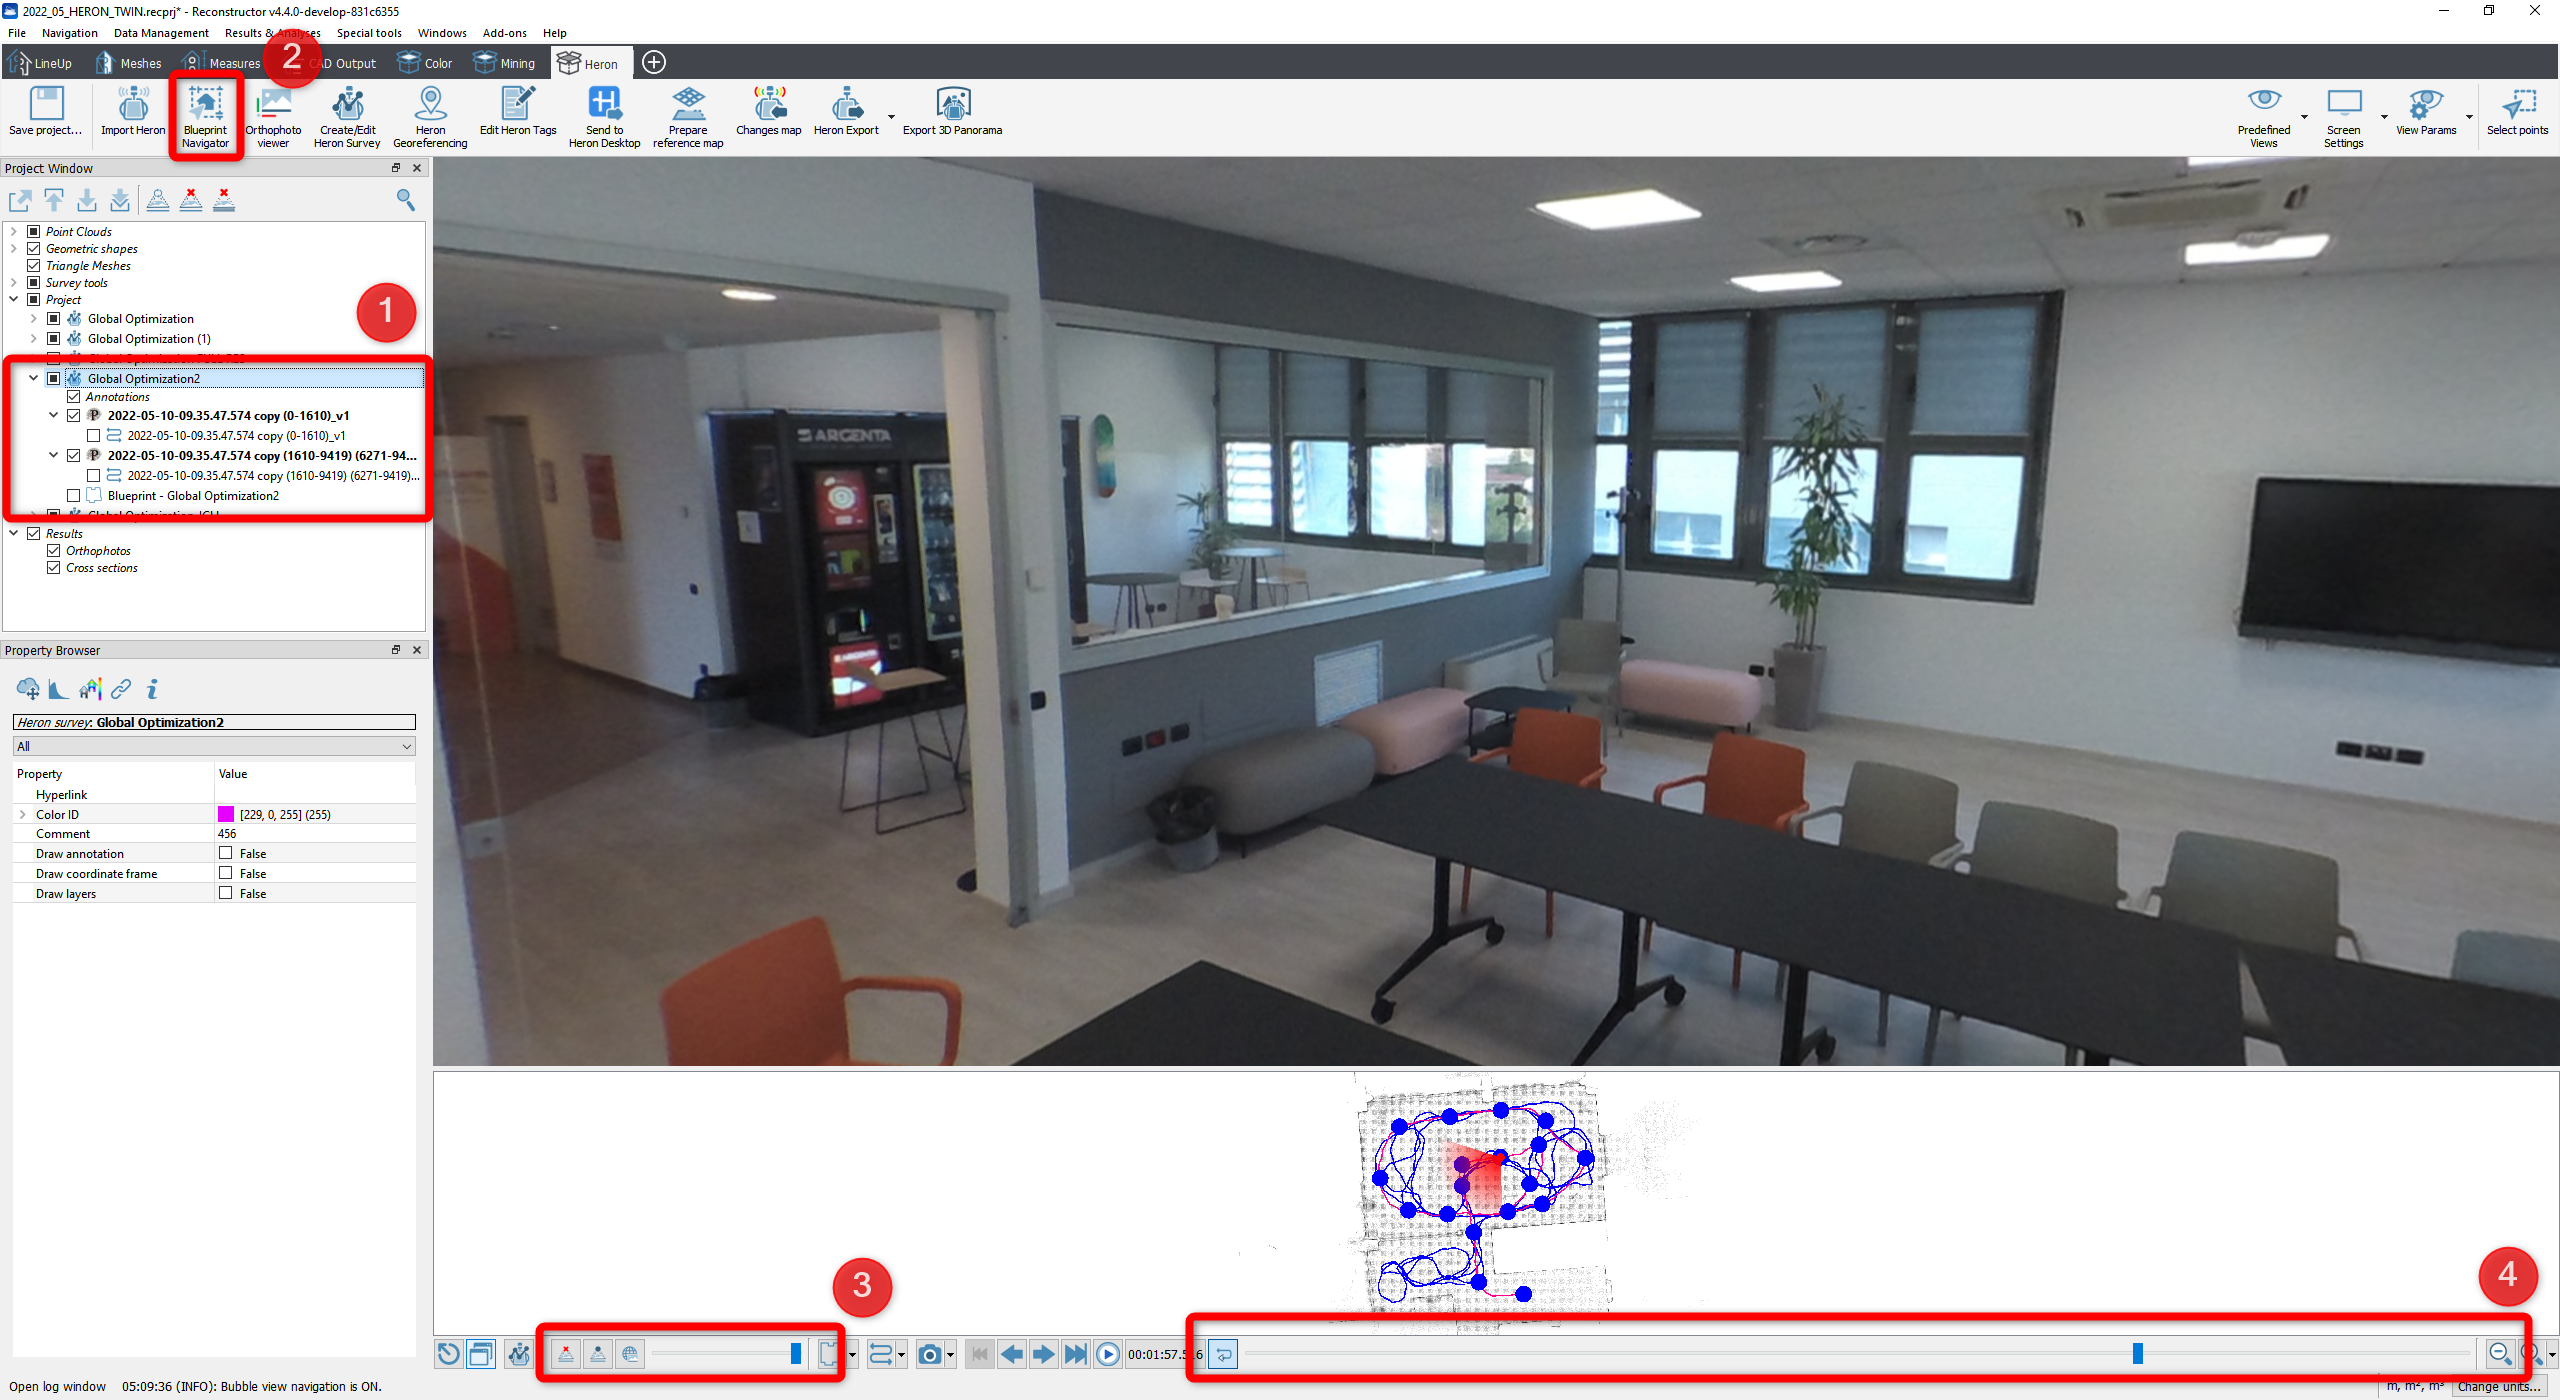
The HERON® survey in Reconstructor® is navigable using the Blueprint Navigator tool. Pressing the Blueprint Navigator button, the Recontructor® 3D window is split into 2 parts:
- On the bottom, the Blueprint is displayed and the trajectory is overlaid. By pressing the trajectory the full HD images are show on the upper window overlaid to the Heron point cloud. In correspondence of the 5K images, a blue dot is drawn; pressing one of the blue dots, the upper view is centered to the 5K related image. Two slide bars are available under the Blueprint: the shorter one change the transparency of the image with respect to the 3D point cloud, the longer one on the right is to navigate along the trajectory path
- Upper part is to navigate in 3D space where the 3D point cloud are displayed with the overlapped spherical images.
For more details about the Blueprint navigator see also here.
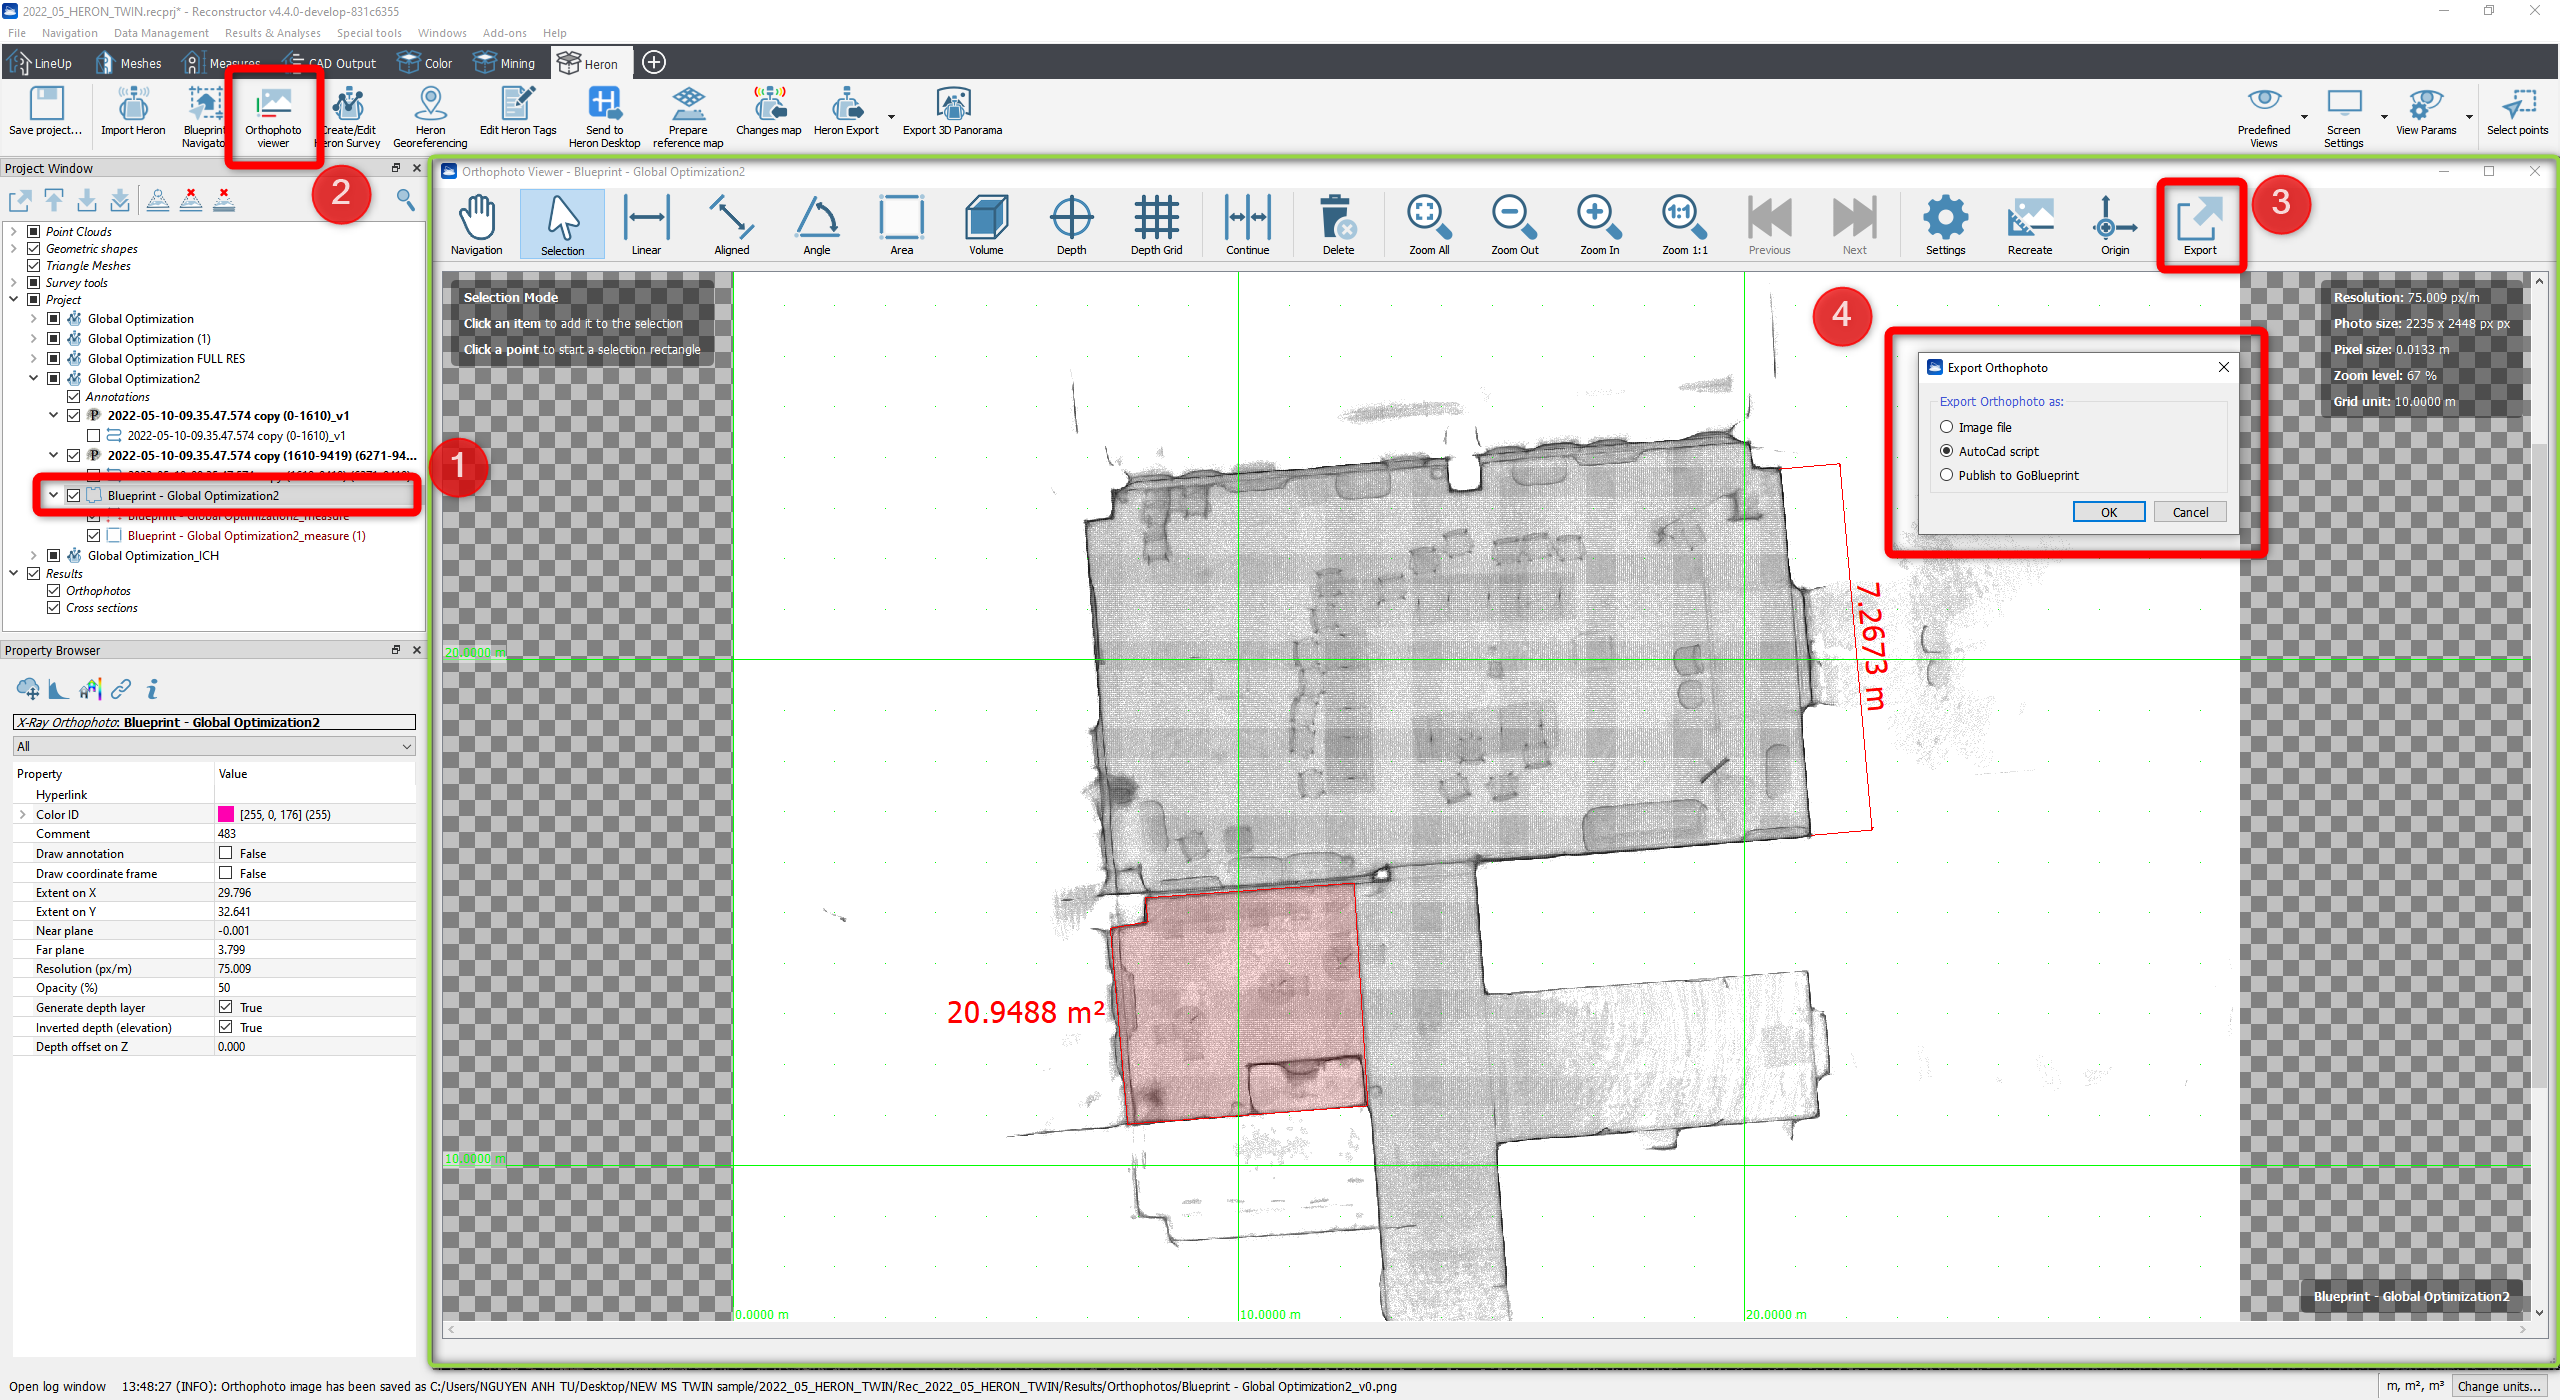
The general Blueprint of the project is listed in the Project window. It can be displayed by using Orthophoto viewer tool. The Orthophoto allows to navigate (zoom/pan) the blueprint, extract linear measures, areas, spot height map. The blueprint and the extracted information can be also exported directly into CAD environment as a scale raster plus vectors. For more details about the blue print navigator see also here.