Add Heron Data To Project
|
|
Add to project Select the desired acquisitions/static tracklet in RESOURCES, then click the Add to project button. |

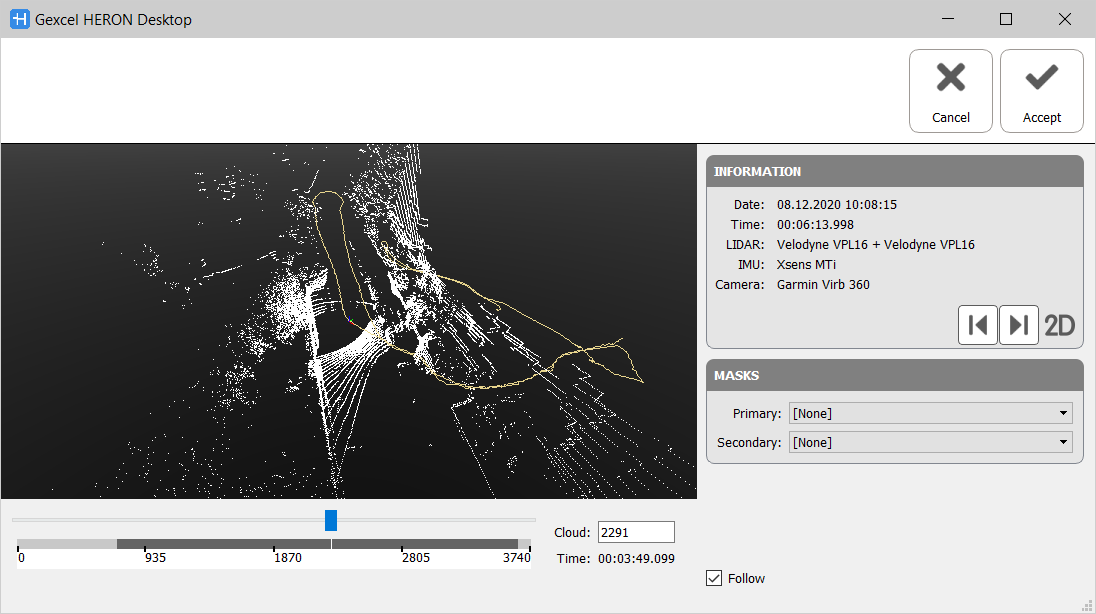
Choose the clouds' range to process by positioning the "time line" slider through the Set Start Position and Set Stop Position button and click on  Accept.
The 2D Range Map Visualizer is also available here, in order to better analyze the data.
In this step it is also possible to set the mask(s) you want to apply to the LiDAR sensor(s).![]() Before to do it remember to define and load the mask's images through the Masks tool.
Before to do it remember to define and load the mask's images through the Masks tool.
Tracklet's Information
After adding a tracklet to the Project, some information about the raw data is available in the Information section: date and time, LiDAR, IMU and camera models, length of the walking trajectory.
Three modalities of visualization can be opened by clicking on the relative buttons:
|
|
To open the Toggle Preview Panel, which provides a simplified 3D visualization of the current point cloud model (clouds and trajectory). After selecting the
click the Generate Preview button |
|
|
To open the Camera Images Visualizer, which provides a panoramic view of the single clouds [only for AC/MS Heron® systems with embedded camera] |
|
|
To open the Tags window, which provides a list of the Tags saved during the Heron® acquisition. |


![]() After importing an acquisition it could be useful to run the Preview
After importing an acquisition it could be useful to run the Preview ![]() in order to detect some areas (and so the related trajectory's sections) in which some relevant issue is present. Here you will probably have to use more strict parameters in processing the Odometer step.
in order to detect some areas (and so the related trajectory's sections) in which some relevant issue is present. Here you will probably have to use more strict parameters in processing the Odometer step.
A splitting can, where appropriate, also be applied to the problematic tracklet, with a view to not to take in account or manage these sections.
When imported in the Project section, a trajectory is identified by the icon ![]() .
.
During the next processes (see Data Processing) the tracklet's icon will take a different color, depending on the process that has been performed on it:
|
|
Red Trajectory If no processes are already performed on the tracklet. |
|
|
Yellow Trajectory If Odometer process has been performed on the tracklet. |
|
|
Green Trajectory If also Create Maps process has been performed on the tracklet. |


